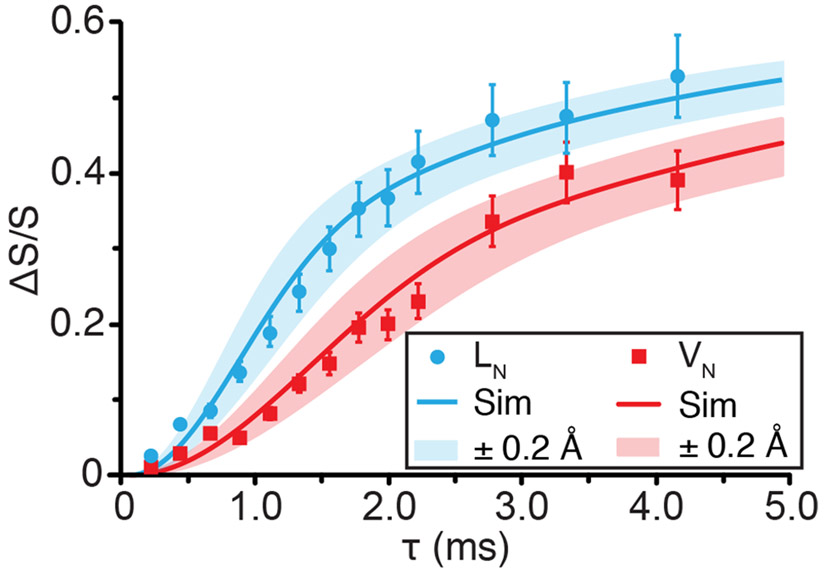
Figure 4.
One-dimensional 15N–17O REAPDOR dephasing curves of the leucine (blue, circle) and valine (red, squares) nitrogens of N-Ac-VL at 17.6 T (ω0H/2π = 750 MHz). Best-fit simulated REAPDOR dephasing curves (solid lines) and ±0.2 Å error (semi-transparent curve) in simulated dephasing curves generated using SIMPSON.76 15N–17O distances that were determined based on the simulated curves are given in Table 5.

