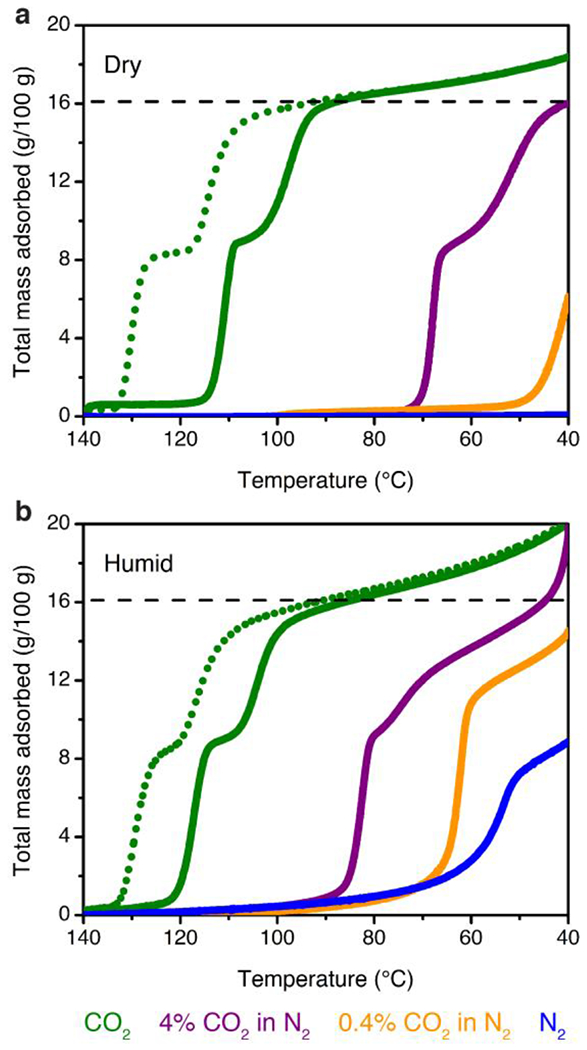
Figure 3.

Dry (a) and humid (b, ~2.6% H2O) isobars at atmospheric pressure for pure CO2 (green), 4% CO2 in N2 (purple), 0.4% CO2 in N2 (orange), and pure N2 (blue) in 2-ampd–Mg2(dobpdc). Solid lines depict adsorption (cooling), and dotted green lines depict desorption (heating) for the pure CO2 isobars. The dashed black lines indicate the theoretical capacity for adsorption of 1 CO2 per diamine. Temperature ramp rates: 0.5 °C/min for pure CO2, 0.1 °C/min for 4% and 0.4% CO2 in N2, and 1 °C/min for pure N2.
