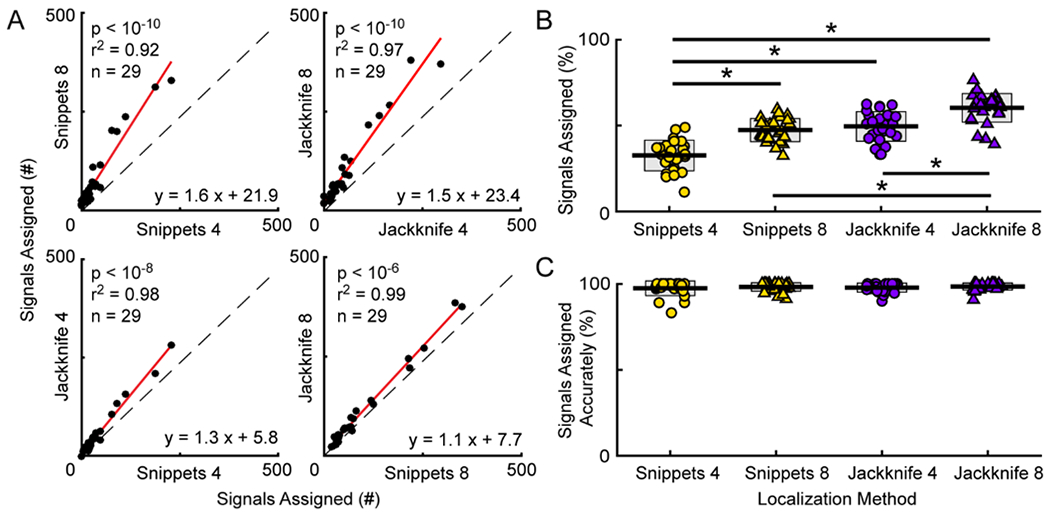
Figure 5. Signal assignment.

A, General linear mixed-effects models were used to calculate the regressions (red lines) comparing the number of vocal signals assigned using different system configurations. Identity lines shown with dashed black lines. Each point is the number of signals assigned in a recording session (n = 29). The equations are that of the regression lines through the data, with the fit of the lines indicated by the r2 values, and the p-values denoting the comparisons between the slopes of the regression and identity lines. B, Percentage of signals assigned in each data set for the different system configurations. * p < 0.05. C, Percentage of assigned signals attributed to the correct mouse in each data set for the different approaches. There were no significant differences across groups. B, C, Each point is the percentage from a single data set. Central line is the mean. Gray boxes indicate standard deviation.
