
Figure 8. Jackknife approach with 8 microphones and no density threshold accurately assigns more vocal signals to mice compared to other approaches.
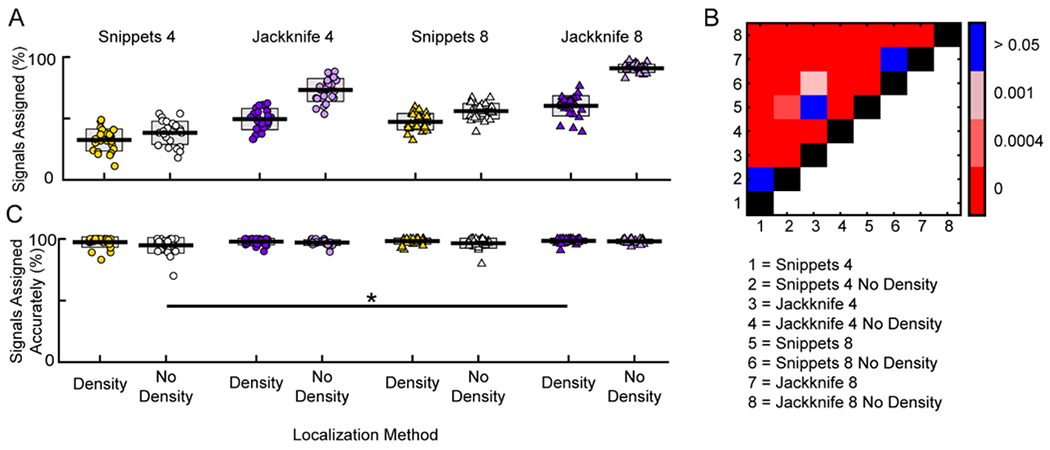
A, Percentage of signals assigned in each data set for the different system configurations. Localization method and number of microphones is indicated above the graph. Presence of a density threshold is indicated beneath C. B, Heat map of significance for all pairwise comparisons in A. Red hues indicate significant pairwise differences, while blue indicates a non-significant difference. Black represents the identity line and white indicates that no comparisons were made. Numbers corresponding to configuration are indicated below the plot. C, Percentage of assigned signals attributed to the correct mouse in each data set for the different approaches. One significant difference was detected (Snippets 4 No Density vs Jackknife 8 with density). A,C, Each point is the percentage from a single data set. Central line is the mean. Gray boxes indicate standard deviation. * p < 0.05