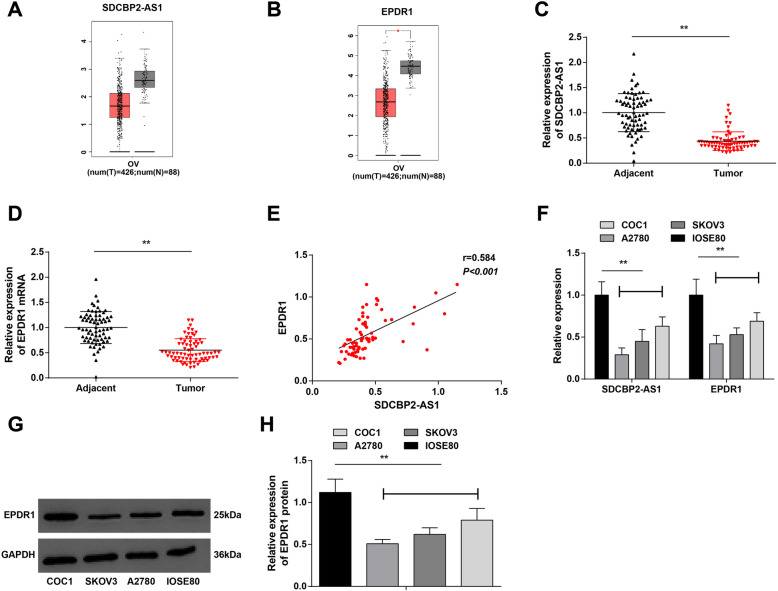
Fig. 1.
Lowly expressed lncRNA SDCBP2-AS1 and EPDR1 present in OC. A LncRNA SDCBP2-AS1 expression in OC tissues reflected by GEPIA website creator; B EPDR1 expression in OC tissues reflected by GEPIA website creator; C RT-qPCR detection of lncRNA SDCBP2-AS1 in OC tissues and adjacent tissues (n = 71); D RT-qPCR detection of EPDR1 in OC tissues and adjacent tissues (n = 71); E correlation between lncRNA SDCBP2-AS1 and EPDR1 levels in OC tissues reflected by Pearson correlation analysis (n = 71); F RT-qPCR detection of lncRNA SDCBP2-AS1 and EPDR1 in OC cell lines (COC1, A2780, and SKOV3) and normal ovarian epithelial cells (IOSE80), repetition = 3; G/H. Western blot analysis of EPDR1 in OC cell lines and IOSE80, repetition = 3; * P < 0.05, ** P < 0.01. Data were expressed in the form of mean ± standard deviation and analyzed by t test, one-way analysis of variance, and Tukey’s multiple comparison test

