Fig. 1.
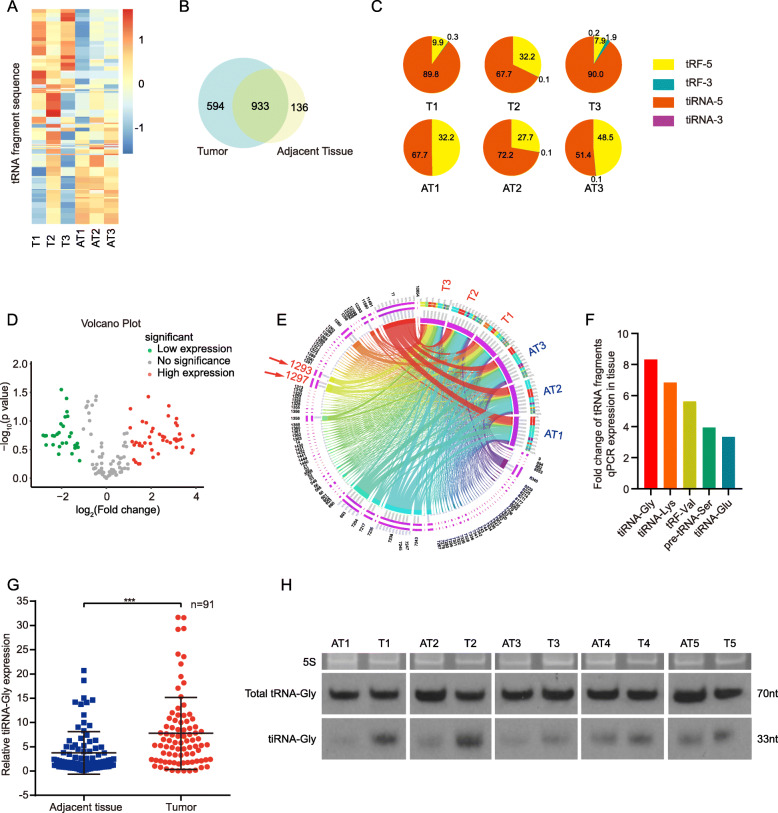
Expression of tRFs and tiRNAs in human PTC tissues. A Heatmap of tiRNAs and tRFs sequence in three pairs of tumors (T) and adjacent tissues (AT) of PTC. B 594 tRNA fragments were detected only in tumor samples (Blue region), 136 tRNA fragments only in adjacent tissues (Yellow region), and 933 tRNA fragments in both tissues (Green region). C 5′-tiRNA (tiRNA-5, orange part) and 5′-tRF (tRF-5, yellow part) account for the most two kinds of tRNA fragments. D Downregulated tRNA fragments (Green dots) and upregulated tRNA fragments (Red dots) in T compared to AT in volcano plot. Red dots means fold change > 2, Green dots means fold change < − 2. E Red arrows point out 5′-tiRNA-Gly-GCC (tiRNA-Gly). Upregulated and down regulated tiRNAs and tRFs in three pairs of T and AT tissue samples are displayed in circos plot. F Expression of selected 5 upregulated tRNA fragments was examined in 91 pairs of human PTC tissues by qRT-PCR. G tiRNA-Gly expression is higher in tumor tissues than in adjacent tissue in 91 pairs of human PTC by qRT-PCR. ***p < 0.001. H tiRNA-Gly is upregulated in tumor (T1–5) than adjacent tissues (AT1–5) by Northern blot (lower bands). Upper bands are 5S rRNA in denaturing gel. Middle bands are total tRNA-Gly

