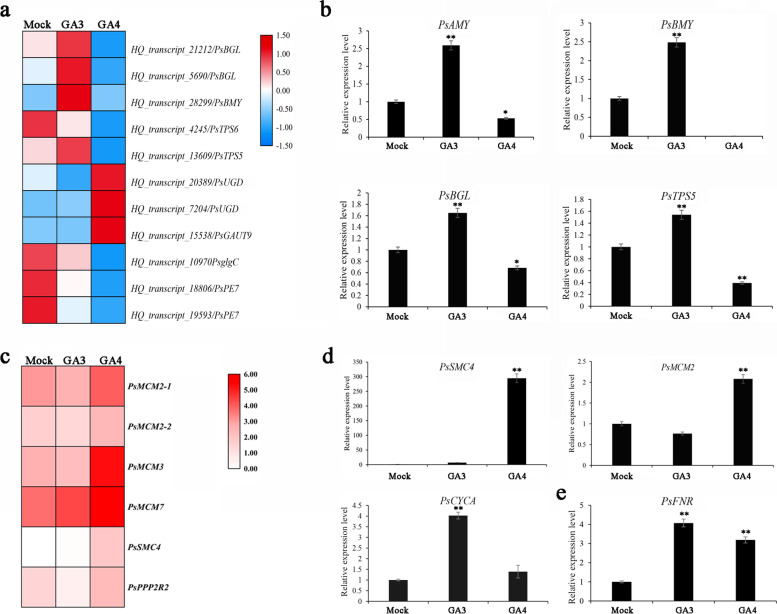
Fig. 6.
The expression levels of starch and sucrose metabolism and cell cycle-related DEGs after GA3 and GA4 applications in P. suffruticosa cv ‘Luhehong’. a Heatmap of starch and sucrose metabolism-related DEGs after GA3 and GA4 applications based on the RNAseq data. b The expression levels of starch and sucrose metabolism -related DEGs after GAs applications by qPCR. c Heatmap of cell cycle-related DEGs enriched in KEGG pathway map based on the RNAseq data. d The expression levels of cell cycle-related DEGs after GAs applications by qPCR. e The expression level of PsFNR after GAs applications by qPCR. Data were represented as mean of three different determinations ± SD. Asterisks indicate statistically significant differences (one-way ANOVA, *p < 0.05, **p < 0.01)

