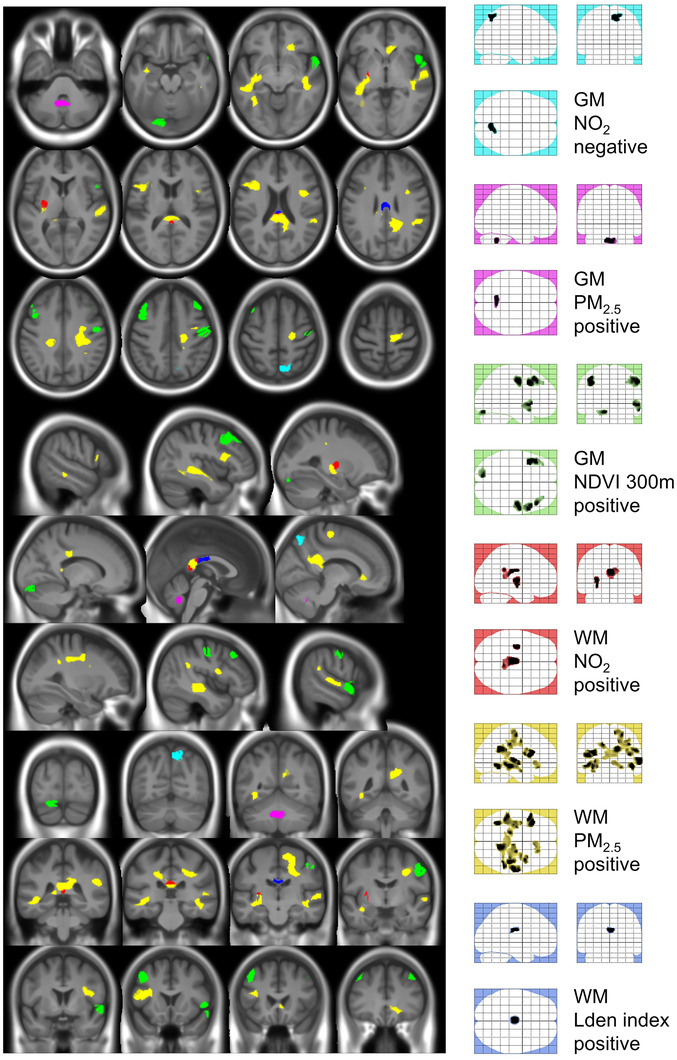
FIGURE 2.

Impact of exposure to air pollutants, noise, and proximity to green areas on gray matter and white matter volume. Colored glass brains in the right column offer a global view of each contribution and act as a legend for color codes: cyan for negative association between NO2 and GM, magenta for positive association between PM2.5 and GM, green for positive association between NDVI 300 m and GM, red for positive association between NO2 and WM, yellow for positive association between PM2.5 and WM, and blue for positive association between Lden index and WM. Refer to Table 3 for detailed description of the clusters. Cluster colors correspond to glass‐brain legend colors and color code in Table 2 for an easier identification. Positive and negative indicate the sign of the association. GM, gray matter; Lden index, day‐evening‐night sound average; NDVI, normalized difference vegetation index; NO2, nitrogen dioxide; PM2.5, fine particulate matter; WM, white matter.
