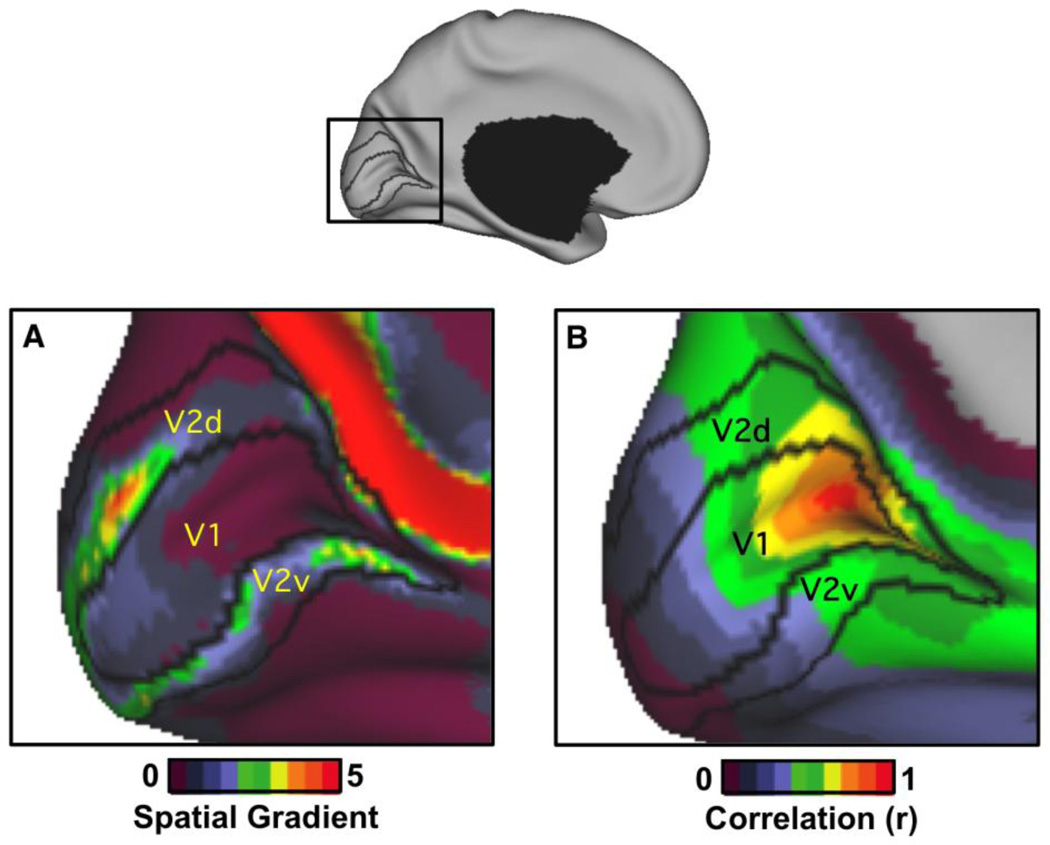
Figure 2. Local spatial gradients and global correlation reveal distinct features of early visual cortex.
Resting-state functional connectivity patterns are plotted in two ways to illustrate distinct features of the correlational structure. In both instances, the exact same data are used from 1000 subjects acquired while subjects rest with their eyes open (Yeo et al., 2011). (A) Highlighting changes in functional connectivity, the spatial gradient of functional connectivity is mapped for visual cortex and overlaid on the V1/V2 architectonic borders. (B) Highlighting global similarity in functional connectivity, the raw correlation for a single seed region placed in peripheral V1 is displayed. The contrast between the two maps illustrates distinct features that boundary mapping and clustering preferentially detect. Boundary mapping is most sensitive to the kind of gradient depicted on the left while clustering is most sensitive to the spatial similarity across space depicted on the right. Specifically, the spatial gradient map displays peak values along the V1/V2 border. In contrast, the peripheral V1 seed region exhibits a supra-areal pattern of correlation spanning V1, V2, and V3. The peripheral V1 seed region is only weakly correlated with central V1 but is strongly correlated to regions of V2 and V3 with similar eccentricity. Quantification of this effect can be found in Yeo et al. (2011) Figures 17 and 18. The gradient map was defined as in Cohen et al. (2008) with the spatial gradient computed via minimally metric-distorted spherical representation as in Yeo et al. (2010). The boundary maps presented in Wig et al. (2013) are processed considerably more than the raw gradient maps illustrated here. Montreal Neurological Institute (MNI) coordinates of the V1 peripheral seed region are -16, - 74, 7. V1/V2 architectonic borders were derived from Fischl et al. (2008).

