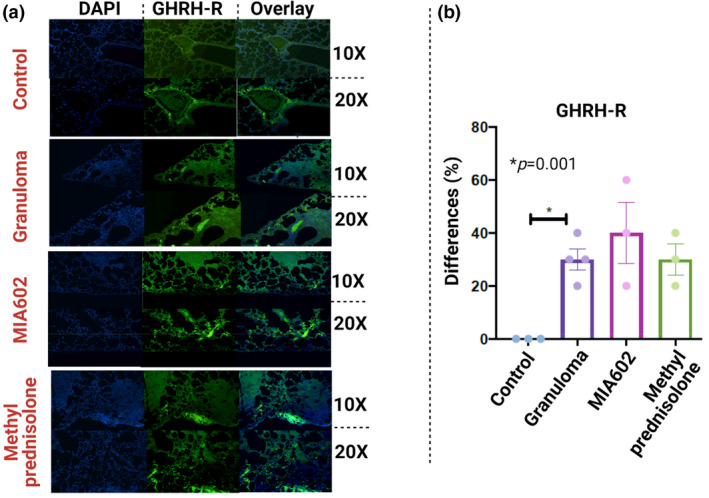
Figure 4.

A representative image immunofluorescence microscopic detection of GHRH‐R in lungs of mice (right lower lobe). Magnifications are 10× and 20× for all representative images (a). P‐value shows percentage differences of lung‐stained cells between challenged mice and controls (N = 3 control, four challenged and three MIA602 mice) (b). Control mice were not challenged, while granuloma and MIA602 groups were challenged with MAB microparticles. The granuloma group received saline as treatment, while the MIA602 group received 5 μg MIA602 daily injection. Control also received saline. The staining intensity and percentage of area extent of the immunohistochemistry were evaluated by two lung pathologists blindly. Data are from one experiment that is representative of three separate experiments.
