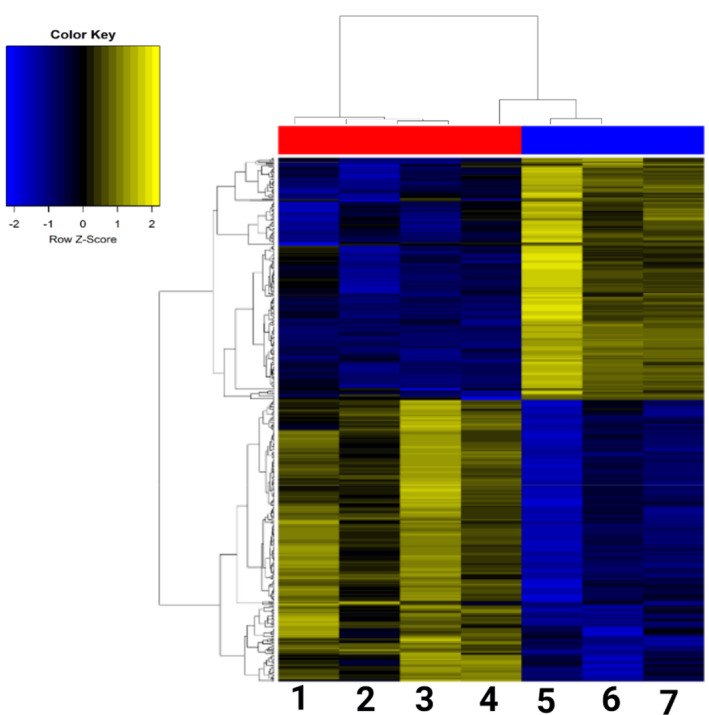
Figure 9.

Heatmap of genes with FC > 2.5. Coding genes were illustrated in the heatmap between mouse lung with granuloma and treated with saline (four mice; codes 1, 2, 3 and 4) vs. mouse lung with granuloma and treated with MIA602 (three mice; codes 5, 6 and 7).
