
Figure 1.
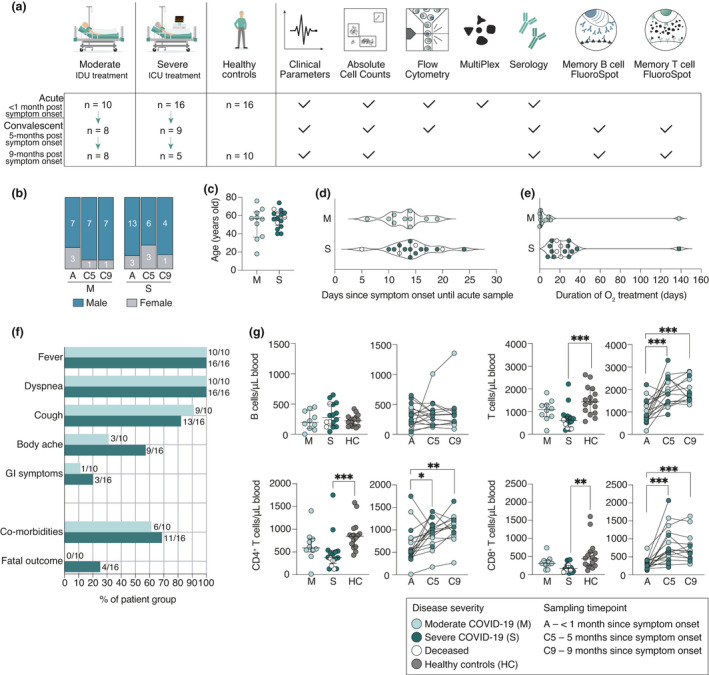
Study design and clinical features of hospitalised COVID‐19 patients. (a) Schematic overview of patient cohorts and experimental setup. IDU, infectious disease unit; ICU, intensive care unit. (b) Sex and (c) age distribution among patients. (d) The number of days from symptom onset to acute sample. (e) The duration of supplemental oxygen treatment among patients during the acute phase. (f) Symptoms, comorbidities and outcome of patients. GI, gastrointestinal symptoms. (g) Absolute cell numbers in peripheral blood of patients during the acute phase, convalescence and in healthy controls. All scatter plots show median and IQR where n = 10 for moderate, n = 16 for severe, n = 16 for healthy control, n = 17 for C5 and n = 13 for C9. Statistical significance in (g) (M, S and HC) was assessed by the Kruskal–Wallis test corrected with Dunn’s multiple comparisons test. Statistical significance in longitudinal plots (g) (A, C5 and C9) was assessed with the Wilcoxon signed‐rank test. *P < 0.05; **P < 0.01; ***P < 0.001.