
Figure 5.
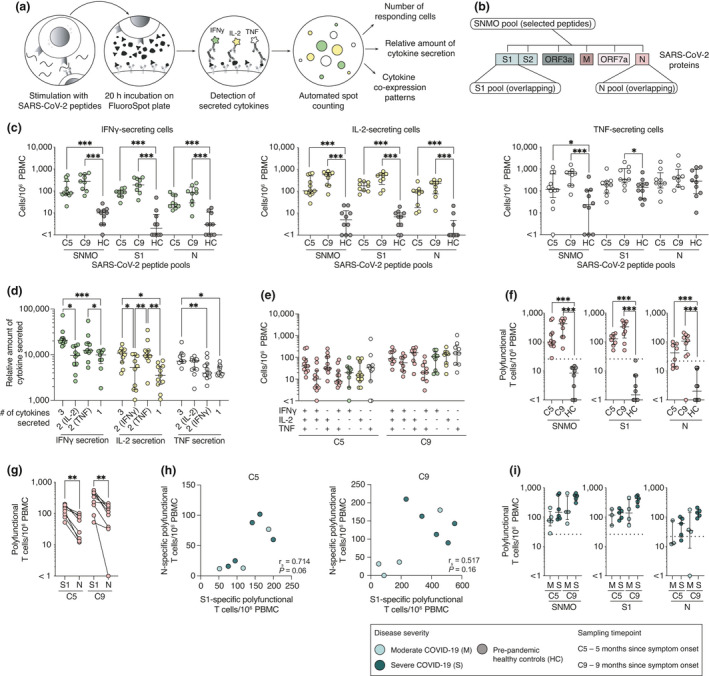
Polyfunctional SARS‐CoV‐2‐specific T cell memory persists at least 9 months after symptom onset. (a) Schematic of memory T cell FluoroSpot assay. (b) SARS‐CoV‐2 peptide pools used in memory T cell stimulation. (c) Total number of cells responding to stimulation by secreting IFN‐γ, IL‐2 or TNF at 5‐ and 9‐month convalescence and in pre‐pandemic healthy controls. (d) Average spot volume (relative amount of cytokine secreted) for IFN‐γ, IL‐2 or TNF produced by cells secreting all three, two or one cytokine after SNMO peptide pool stimulation at 5 months. (e) Cytokine co‐expression patterns of responding T cells after stimulation with SNMO peptide pool at 5 and 9 months. (f) Total number of polyfunctional T cells (cells secreting at least two cytokines) after stimulation. (g) Comparison between the numbers of polyfunctional T cells after the stimulation with S1 or N peptide pools for each patient. (h) Spearman’s correlation between S1‐ and N‐specific polyfunctional T cell numbers at 5 and 9 months. r s, Spearman’s correlation coefficient. (i) Comparison of polyfunctional T cell numbers responding to SARS‐CoV‐2 peptide pools between moderate and severe patients at 5 and 9 months. Median and IQR are plotted in all scatter plots where at 5 months n = 11 for SNMO, n = 8 for S1, n = 8 for N; and at 9 months n = 9 for SNMO, n = 9 for S1, n = 9 for N; and for HC, n = 10 for SNMO, S1 and N. Dotted horizontal lines represent threshold for positive response defined by average polyfunctional T cell numbers in pre‐pandemic healthy controls after stimulation plus three standard deviations. Statistical significance in (c, f and i) was assessed using the Mann–Whitney U‐test, in (d) using the non‐parametric Friedman test and in (g) using the Wilcoxon signed‐rank test. *P < 0.05; **P < 0.01; ***P < 0.001.