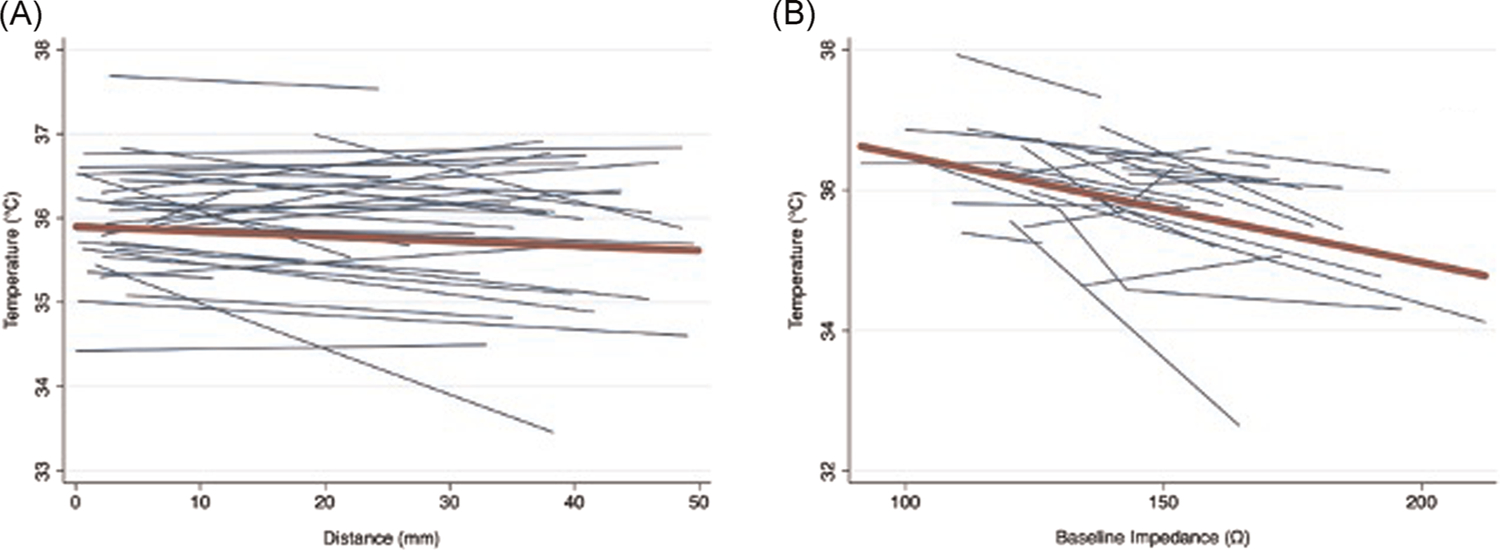
FIGURE 2.

Spaghetti plots of the univariable association of esophageal luminal temperature versus lesion distance and baseline impedance. The plots show a separate regression line (blue lines) for each patient representing the association between esophageal luminal temperature with (A) lesion distance and (B) baseline impedance. The line of best fit (red) represents the overall association as approximated by the univariable generalized estimating equations models in this study
