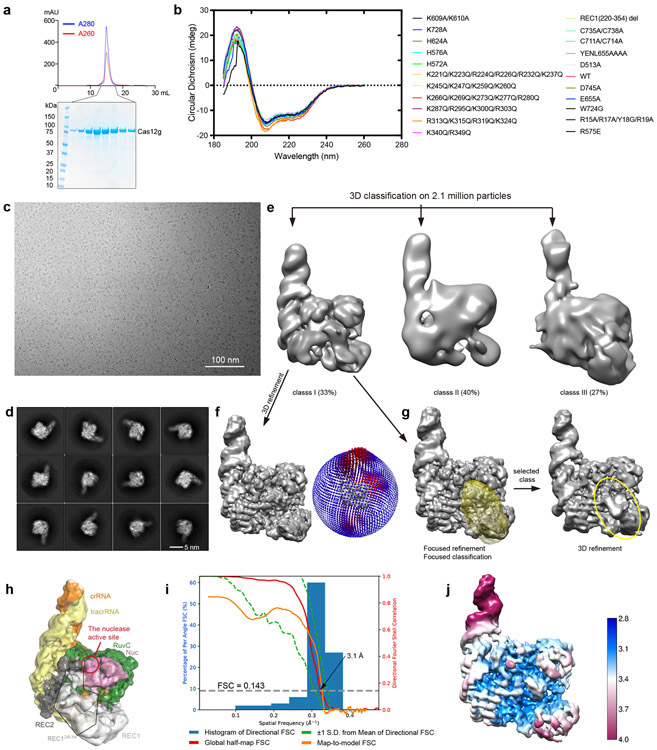
Extended Data Fig.1. Sample preparation and cryo-EM of the Cas12g-sgRNA binary complex.
a, Purification of Cas12g. Upper: Size exclusion chromatography (SEC) profile. UV absorbance curves at 280 nm and 260 nm are shown in blue and red, respectively. Lower: SDS-PAGE analysis. b, Circular dichroism (CD) spectra of wild-type and mutants of Cas12g used in this study. c, A representative raw cryo-EM micrograph of the Cas12g-sgRNA complex from a total of 2520 micrographs. d, Representative 2D class averages from a total of 100 images. e, Three major classes from 3D classification. f, 3D refinement for Class I with angular distribution of particles. g, Focused classification around the flexible region of the REC1 domain (REC1220-354). h, Cryo-EM map of class I with each domain of Cas12g and sgRNA colored coded. i, Plot of the global half-map FSC (solid red line), map-to-model FSC (solid orange line), and spread of directional resolution values (±1σ from mean, green dotted lines; the blue bars indicate a histogram of 100 such values evenly sampled over the 3D FSC). FSC plot for the reconstruction suggests an average resolution of 3.1 Å. j, Local resolution map for the reconstruction in f.

