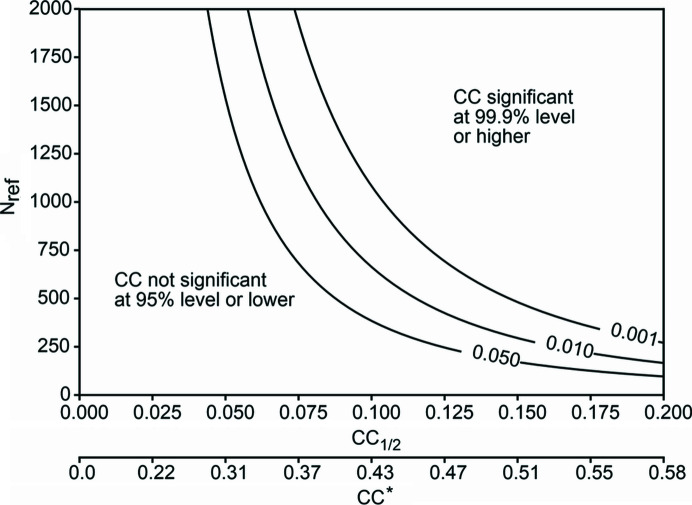
Figure 1.
A contour plot showing the probability α that a certain CC1/2 value calculated for a particular number of observations N ref arises from pure chance. The lines for α = 0.05, 0.01 and 0.001 are plotted. Below the α = 0.05 line, the correlation would not be considered significant and thus is produced by noise at 95% level of confidence or even lower. This may correspond to an appreciable value for CC* (lower axis).

