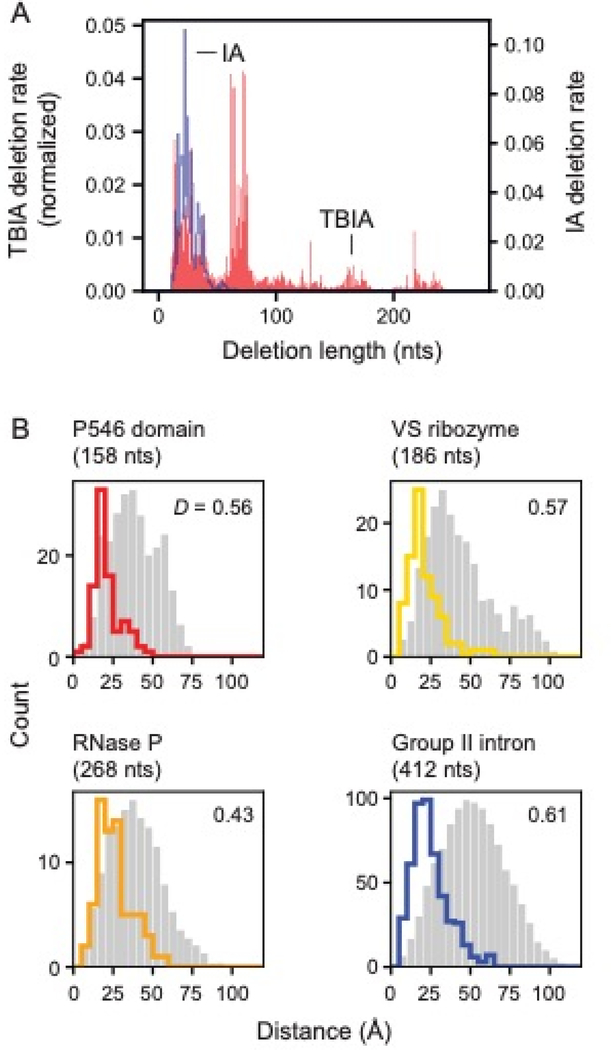
Figure 4: SHAPE-JuMP deletion detection as a function of intervening sequence length and through-space distance.
(A) Deletion rates of a given length due to treatment with monoadduct-forming IA and crosslinker TBIA for the RNase P RNA. Deletion rates are normalized to sum to 1. (B) Distances between nucleotides that mediate TBIA-induced deletions. The most frequent three percent of deletion rates are shown with colored lines. Random internucleotide distances based on the reference structure, that follow the same sequence length distribution as TBIA-induced contacts, are shown in gray. D, the Kolmogorov-Smirnov metric, quantifies separation between two distributions on a 0 to 1 scale with 0 indicating no separation and 1 indicating complete separation; all D values correspond to p-values ≤ 10–5.

