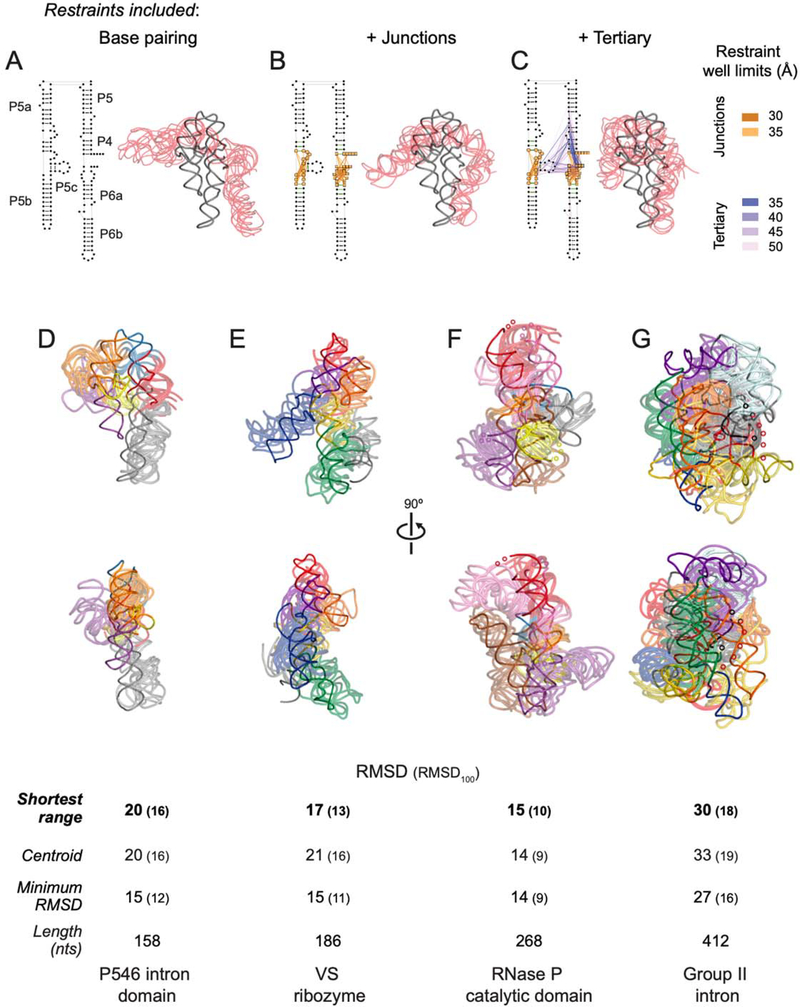
Figure 7: SHAPE-JuMP directed structure refinement.
(A-C) Restraints superimposed on secondary structure and resulting three-dimensional models for the stepwise DMD refinement of the P546 intron domain. Five modeled structures (transparent red), consisting of the centroid and four models with lowest RMSD as compared to this centroid, aligned to the reference structure19 (gray) are shown. Restraints were added stepwise, (A) starting with the base paired secondary structure, (B) adding SHAPE-JuMP restraints at multi-helix junctions (orange lines), and (C) adding high frequency proximity interactions (purple lines). Lengths of restraint wells used during DMD refinement are color-coded. (D-G) Structures obtained using JuMP data-informed DMD aligned to the (D) P546 domain (PDB ID 1gid), (E) VS ribozyme (4r4p), (F) RNase P catalytic domain (3dhs), and (G) group II intron (3igi). JuMP restraints were mapped on to final models. The five models with the shortest restraint distance ranges were taken as representative of the simulation. Structures are colored by major helical elements. Modeled and accepted structures are shown with transparent and solid backbone traces, respectively. RMSD values are shown for: models with shortest restraint distance range, centroid of the largest cluster, and lowest RMSD model obtained. RMSD100 values (in parentheses) report a length normalized RMSD33. Regions not visualized in accepted structures are indicated with small spheres.

