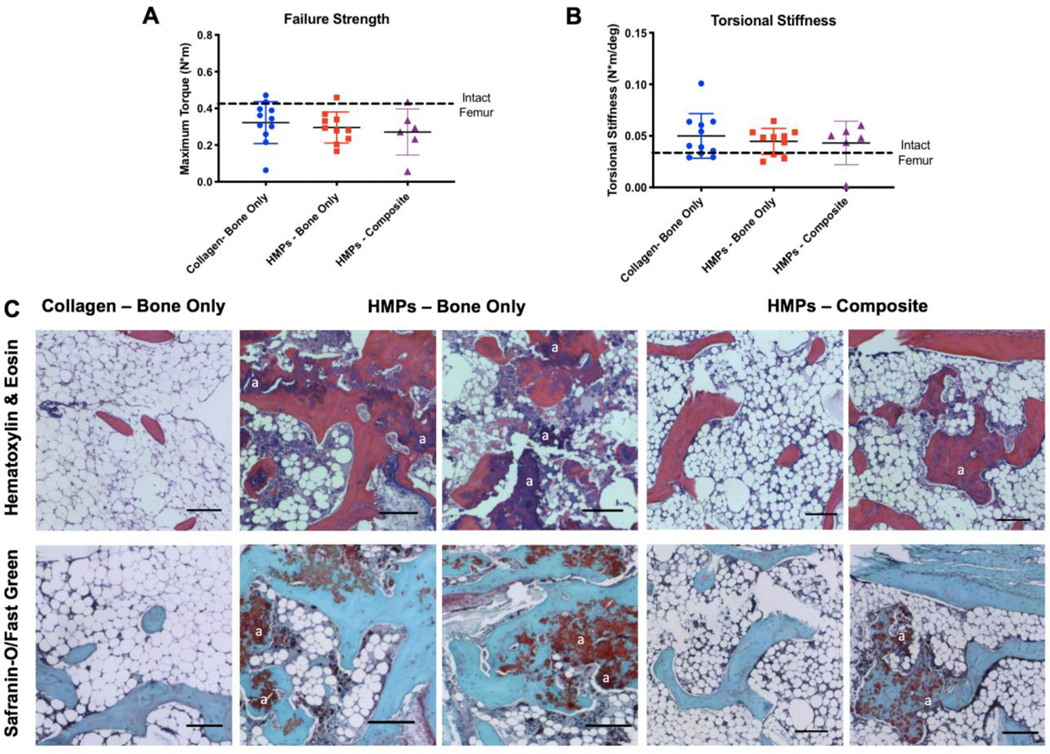
Figure 5. Biomechanical testing and histological analysis.
Mechanical testing of A) failure strength and B) torsional stiffness shows no difference between groups. The dotted black line indicates the average failure strength and torsional stiffness of the contralateral intact femurs, respectively. C) Staining with Hematoxylin & Eosin and Safranin-O/Fast Green at the 12 week endpoint (20 weeks post-injury) shows mineralized tissue in the HMP groups and non-mineralized, marrow-like tissue in the collagen group. Residual alginate can also be seen in the HMP groups and examples are marked with an “a”. Scale – 150um.

