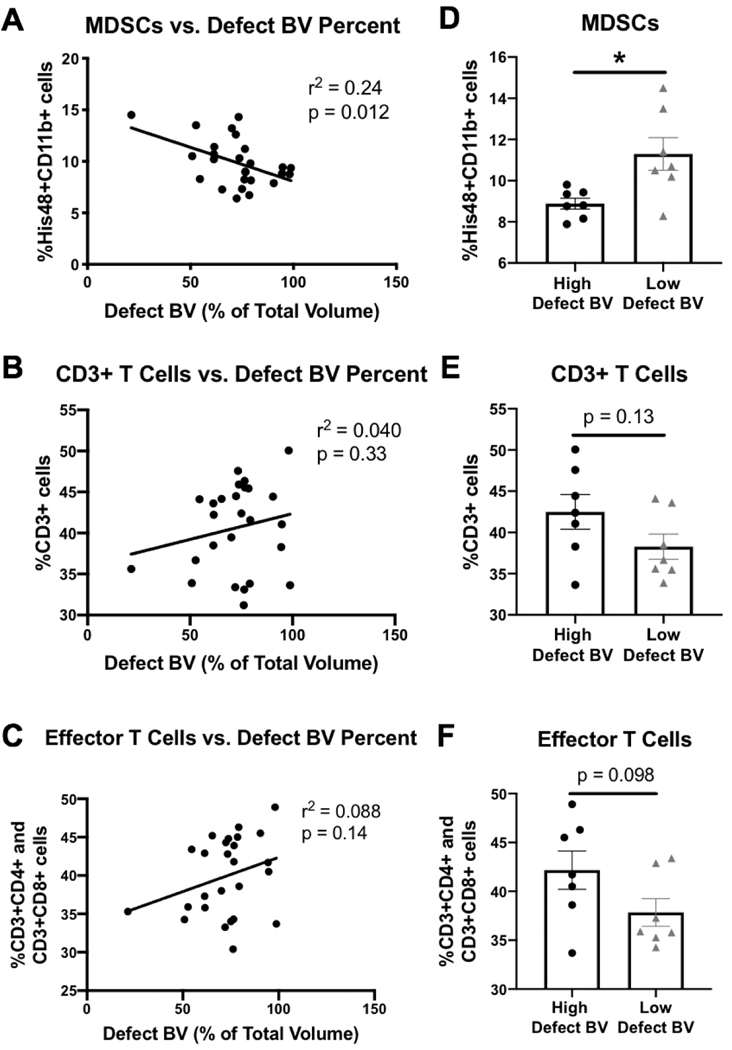
Figure 6. Linear regression analyses comparing systemic immune cell populations with defect bone volume percent.
Linear regressions comparing defect bone volume as a percent of total bone volume versus week 12 (endpoint) circulating immune cell populations for A) MDSCs, B) CD3+ T cells, and C) effector T cells which includes both helper (CD3+CD4+) and cytotoxic (CD3+CD8+) T cells with r2 and p values as indicated. Removal of the middle 50% of the data set according to defect bone volume percent left 25% of the lowest defect bone volume percent samples and 25% of the highest defect bone volume percent samples. The high defect bone volume percent samples and the low defect bone volume percent samples were then compared for their levels of D) MDSCs, E) CD3+ T cells, and F) effector T cells. Mann-Whitney or Student’s t-test were performed with p values as indicated or a * (p = 0.011).

