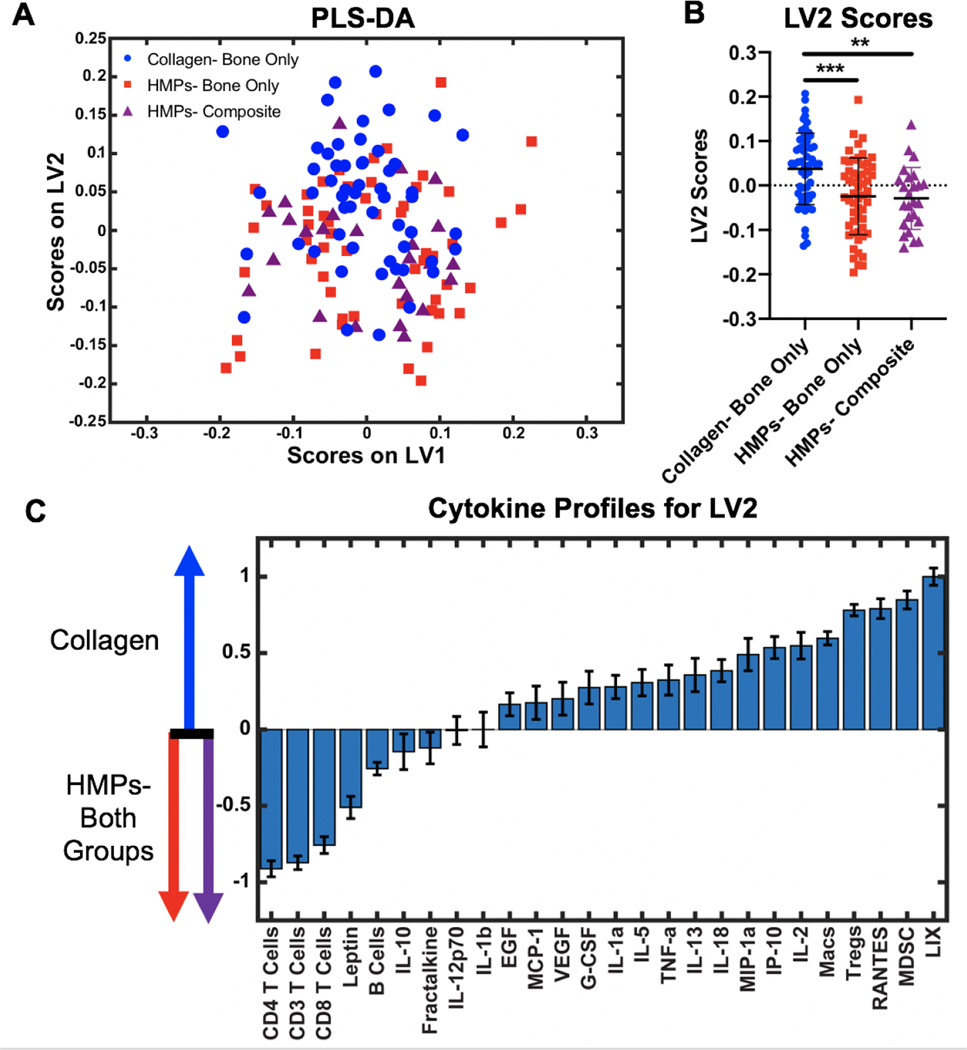
Figure 7. Multivariate analysis of the systemic immune response.
A) PLS-DA plot shows all cytokine levels and cell populations for the collagen treated group (blue circles), the HMP treated bone only nonunion model (red squares), and the HMP treated composite defect nonunion model (purple triangles) plotted on the latent variable 1 (LV1) axis and the latent variable 2 (LV2) axis. Cytokine levels and cell populations were pooled across all time points. Significance was determined using one-way ANOVA with Tukey’s post hoc test where p<0.01(**) and p<0.005(***). B) Plotting only LV2 scores reveals a significant separation between the collagen group and the HMP groups. C) The LV2 loading plot shows the top factors most correlated with positive LV2 scores on the right (collagen group) and the top factors most correlated with negative LV2 scores on the left (HMP groups). There was no significant separation between the two HMP treated groups.

