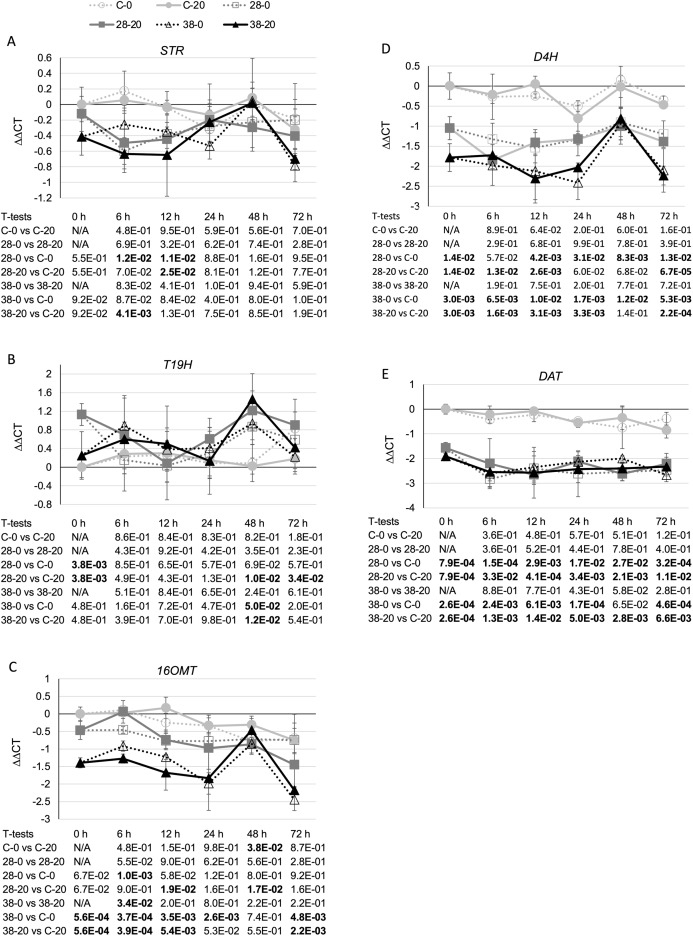
Figure 5. Time course of expression of TIA biosynthetic genes.
(A) STR, (B) T19H, (C) 16OMT, (D) D4H and (E) DAT transcript levels were assayed in the XPZ28 (28), XPZ38 (38) and control lines (C) grown on 0 µm (0) or 20 µM (20) beta-estradiol and harvested at the indicated time points. The results of Student’s T-tests, comparing different lines or treatment conditions at different time points, are shown below each graph. T-test results below 0.05 are highlighted by bold font. Results are the average ∆∆CT value of three biological replicates, with two technical replicates per biological replicate. Error bars indicate standard deviations.

