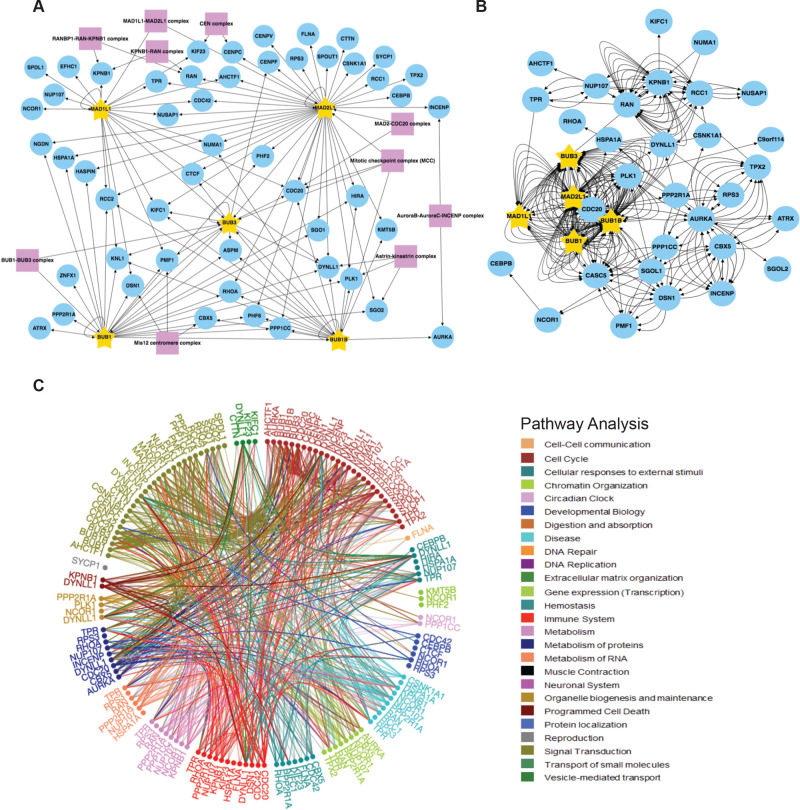
Figure 4.
SAC protein BioID2 kinetochore/mitotic spindle assembly/centromere proximity association network. (A) Individual core SAC protein (BUB1, BUB3, BUBR1, MAD1L1, MAD2L1) proximity protein maps were compiled and subjected to kinetochore, mitotic spindle assembly, and centromere GO annotation analysis along with a COURM complex annotation analysis to generate a core SAC protein kinetochore/mitotic spindle assembly/centromere proximity association network. Purple boxes highlight kinetochore, mitotic spindle assembly, and centromere-associated protein complexes present in the network. Arrows indicate the direction of the detected interactions. For a list of GO terms used, see Table S8. (B) Core SAC protein kinetochore/mitotic spindle assembly/centromere proximity association network was analyzed with BioGRID to reveal previously verified protein associations. Each arrow indicates an experimentally annotated interaction curated in the BioGRID database. The direction of arrows indicates an annotated interaction from a bait protein to the prey. (C) Reactome pathway analysis of the core SAC protein kinetochore/mitotic spindle assembly/centromere proximity association network. The Reactome circular interaction plot depicts the associations between the identified proteins within the SAC protein kinetochore/mitotic spindle assembly/centromere proximity association network and the corresponding pathways in which they function. Legend presents the color-coded pathways that correspond to the circular interaction plots.

