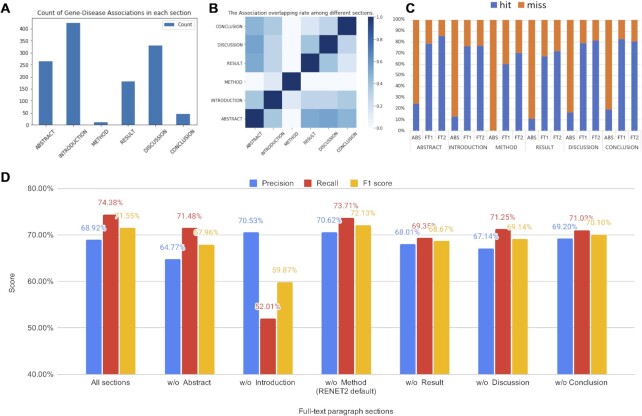
Figure 3.
Gene–disease RE in different full-text sections and their effect on RENET2 models. (A) The count of ‘Associated’ predictions in different sections. (B) The association overlapping rate among different sections. The darker color indicates a higher overlap rate. (C) The recall rate of multiple RENET2 models on different sections. ABS: model trained with 1000 abstracts, FT1: 500 full texts 1st curation, FT2: 500 full texts second curation. (D) RENET2’s performance after removing different sections from training.

