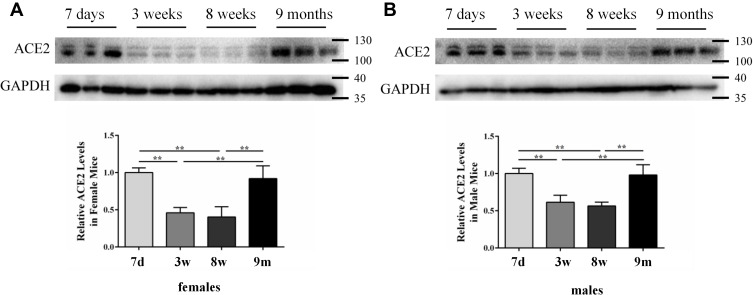
Figure 1.
ACE2 expression in mouse lung tissues measured via Western blotting: (A) females and (B) males. GAPDH was used as a loading control. Values are represented as mean ± SD (n = 3). The sizes of the molecular weight markers are shown on the right-hand side, representing 130 kDa, 100 kDa, 40 kDa, and 35 kDa proteins. **, P < 0.01.

