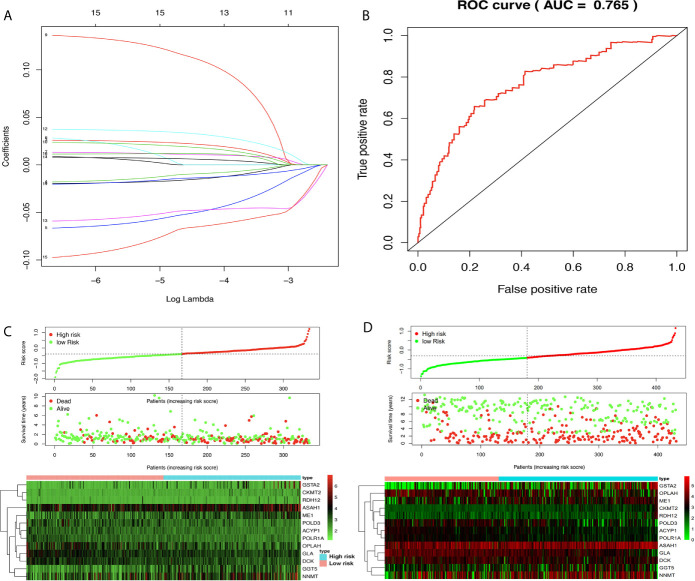
Figure 5.
Lasso regression identified the prognostic model in adenocarcinoma (STAD). (A) Lasso regression complexity was controlled by lambda using the ‘glmnet’ package in R. (B) The receiver operating characteristic (ROC) score in STAD based on The Cancer Genome Atlas (TCGA) data. (C) Riskplot heatmap between high- and low-risk score groups based on TCGA data. (D) Riskplot between high- and low-risk score groups based on n GEO data.

