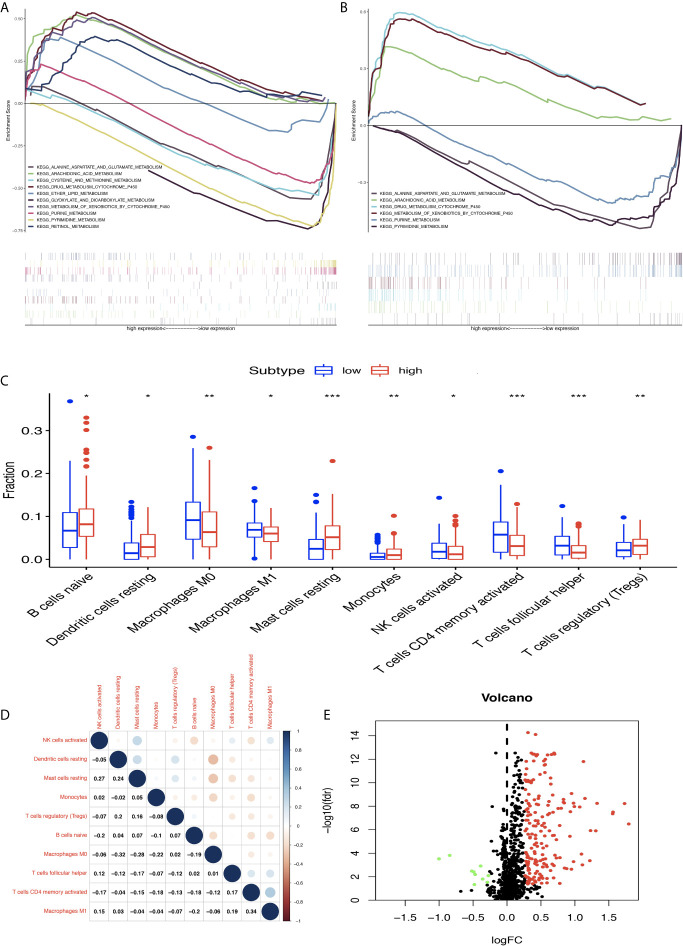
Figure 7.
Differentially expressed immune-related genes (DEIRGs) based on Molecular Signatures Database (GSEA) data and different immune responses between high- and low-risk score groups in stomach adenocarcinoma (STAD). (A) DEIRGs between high- and low-risk score groups based on The Cancer Genome Atlas (TCGA) data. (B) DEIRGs between high- and low-risk score groups based on Gene Expression Omnibus (GEO) data. (C) The differential distribution of immune cells between high- and low-risk score groups. (D) The correlation between 10 types of immune cells in STAD. (E) Volcano plot of DEIRGs in STAD between high- and low-risk score groups. Upregulated DEIRGs are shown as red points, and downregulated DEIRGs are shown as green points. *p < 0.05, **p < 0.01, and ***p < 0.001.

