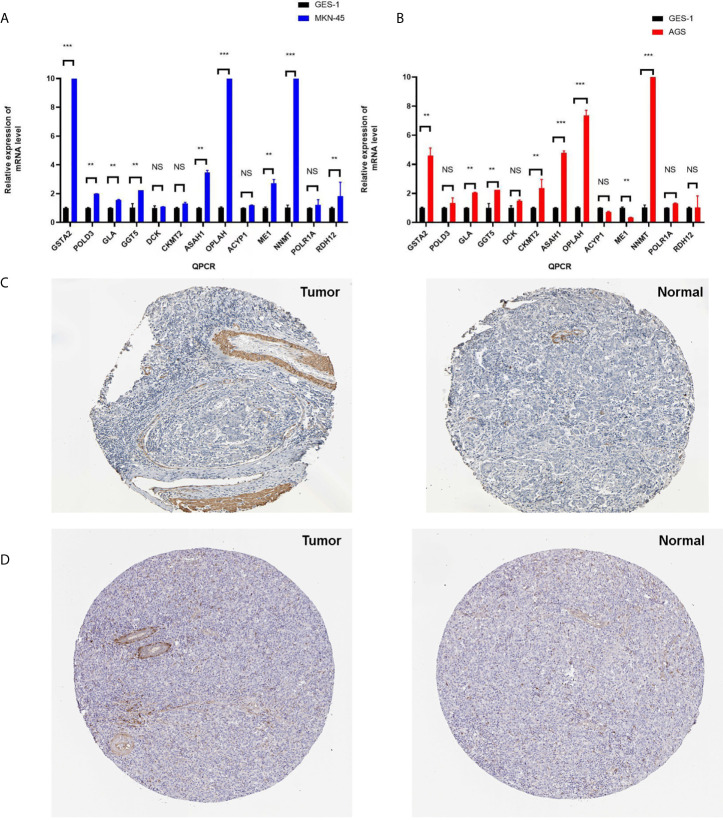
Figure 9.
The verification of identified genes using PCR and HPA database. (A) Q-PCR was used to validate the expressions of 13 metabolism-related genes (GSTA2, POLD3, GLA, GGT5, DCK, CKMT2, ASAH1, OPLAH, ME1, ACYP1, NNMT, POLR1A, and RDH12) between MKN-45 and GES-1. (B) Q-PCR was used to validate the expressions of 13 metabolism-related genes (GSTA2, POLD3, GLA, GGT5, DCK, CKMT2, ASAH1, OPLAH, ME1, ACYP1, NNMT, POLR1A, and RDH12) between AGS and GES-1. (C) Protein expression level of GSTA2 was verified in the Human Protein Atlas (HPA). (D) Protein expression level of ASAH1 was verified in the HPA. *p < 0.05, **p < 0.01, and ***p < 0.001. NS, None significance.

