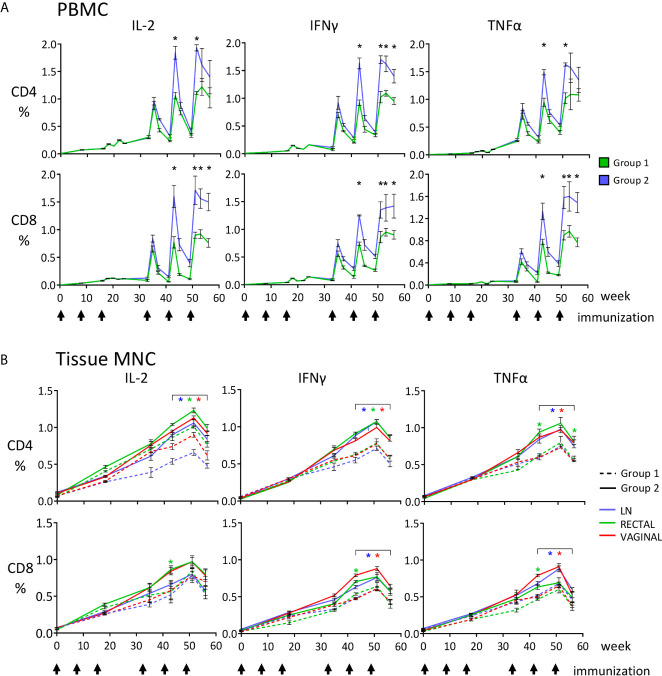
Figure 3.
Quantitative analysis of the anti-SHIV cell-mediated responses measured during the immunization phase, reported as percentages of CD4+ and CD8+ T cells producing IFNγ, TNF-α and IL-2, detected by ICS and flow cytometric analysis upon stimulation with SIV Gag or HIV Env peptide pools. (A) PBMC, asterisks indicate that T-cell percentages (Gag + Env) at the indicated time points are significantly higher for Group 2 (SHIVBG505-DNA+SHIV BG505-OPV, blue) compared to Group 1 (SHIVBG505-DNA+ rMVA-SHIV-BG505, green); (B) LN, rectal and vaginal MNC; the graphs show the total SHIV-specific T-cell responses (Gag + Env) for the two vaccinated groups, Group 1 (dashed line) and Group 2 (solid line). Color refer to the source of samples examined (LN, vaginal or rectal). The color of the asterisks used in panel (B) to report statistical significance matches the color used for the samples in question. Asterisks under brackets indicate that values from week 43 to week 56 are all significantly higher for the specific tissue when Group 2 is compared to Group 1 (p value range: 0.0001-0.039). Between groups comparisons reported in panels (A, B) were carried out by two-tailed, t test or Mann-Whitney U test when the value distribution was non-parametric.

