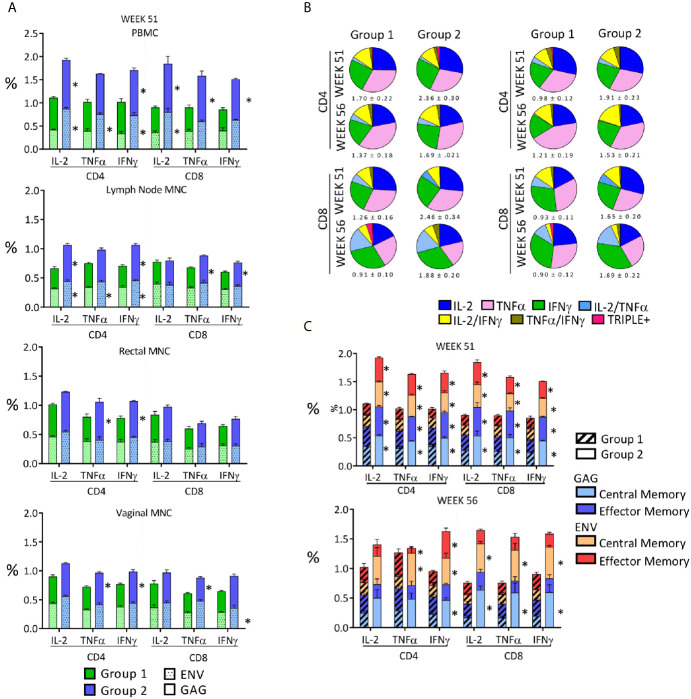
Figure 4.
Qualitative analysis of the anti-SHIV cell-mediated responses stimulated by the vaccination. (A) Anti-SIV Gag and Env percentages observed 2 weeks after the last immunization in the two vaccinated groups in PBMC, LN, rectal and vaginal MNC. Asterisks indicate significant difference between Group 1 and Group 2 and are placed adjacent to the relevant column segment. (B) Pie graphs representing the diversity of anti-SHIV CD4+ and CD8+ T-cell responses as relative fractions of the total percentages of positive cells, expressing a IFNγ, TNF-α and IL-2 alone or a combination of them within anti-SIV gag (left panel) or anti-HIV env (right panel) responses. Functional analysis is in biopsies 2 weeks after the last immunization (week 51) and two weeks before challenge (week 56). The total mean percentage and SE of the antigen-specific responses for each analyzed variable is shown below each pie. (C) Central memory (CM) and effector memory (EM) fractions in SHIV-specific cell-mediated T-cell responses present in PBMC on week 51 (2 weeks after last immunization) and week 56 (naïve cells: CD28+CD95-; memory T cells: CD28+CD95+; and effector T cells: CD28-CD95+). The average percentages of anti-Gag and anti-Env T cells in each group are stacked in the column and shaded differently. Asterisks adjacent to column segments indicate a significant difference between Groups 1 and 2 for that segment. Between groups comparisons reported in panels (A, C) were carried out by two-tailed, t test or Mann-Whitney U test if the value distribution was non- parametric (p value range: 0.0001-0.045).

