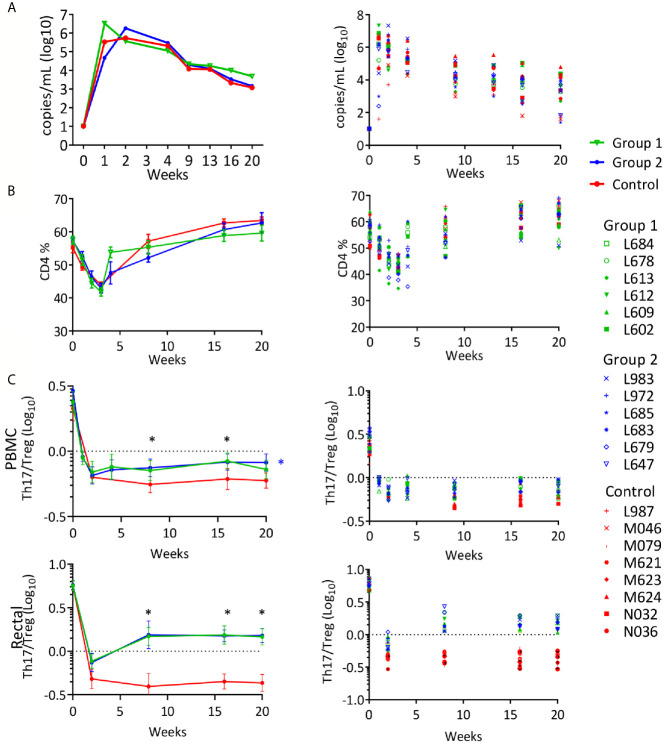
Figure 5.
Rectal SHIVBG505 challenge outcome: (A) Viral loads reported as geometric group means (Log10) in the left panel and for each individual animal in the right panel. (B) PBMC CD4+ T-cell levels reported for each group as average percentages (left panel) or as percentages for each animal (right panel) during the course of the infection. (C) Th17/Treg ratio in PBMC (top) and rectal MNC (bottom) CD4+ T cells, reported as group average ± SE (left panel) or as individual values for each animal (right panel) during the course of the infection. Statistical significance among groups was tested with 1-way ANOVA with Sidak’s multiple comparisons test (*p value range: 0.0001-.021). Black asterisks indicate time points when both Group 1 and Group 2 values were significantly greater than those in the control group. The blue asterisk in the PBMC panel indicates significance for Group 2 value vs. control group.

