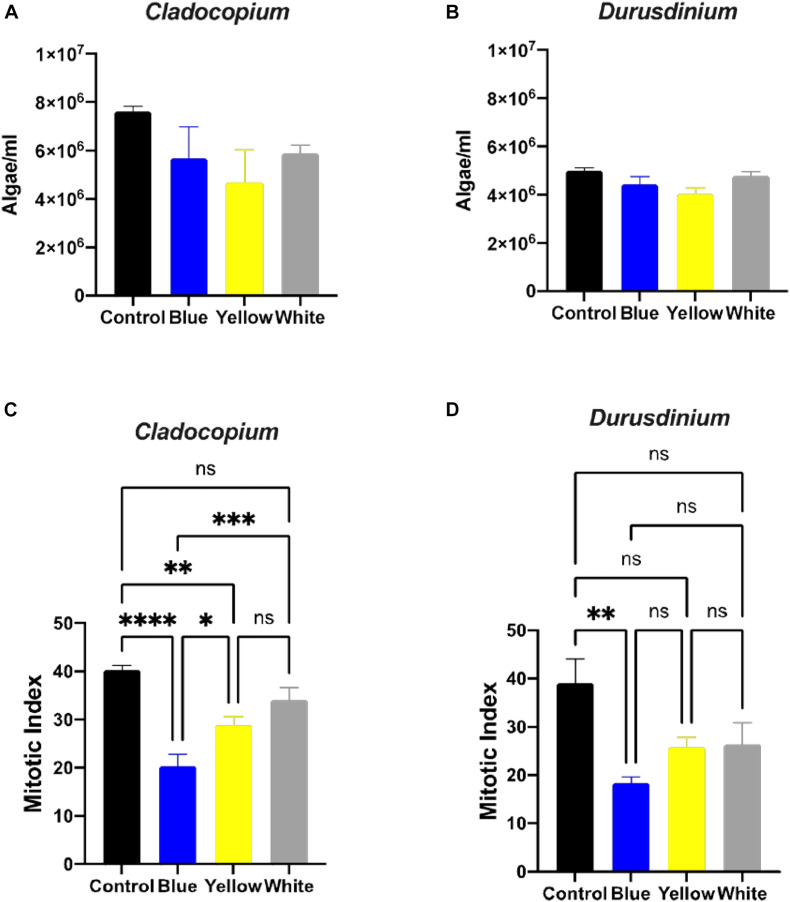
FIGURE 1.
Algae growth and mitotic index ration of the two algae cultures exposed to ALAN. No significant differences in algae density in Cladocopium and Durusdinium cell cultures (A,B) after one-month exposure to ALAN resulting from blue, yellow or white LEDs; irradiance level 0.15 μmol quanta m–2 s–1 (4–5 lux). Data are expressed as mean ± SEM (n = 3). One way-Anova (p > 0.05) between control and different light treatments (A,B). In contrast there are significant differences in the Mitotic Index (MI) (C,D), Data are expressed as mean ± SEM (n = 3), ANOVA was followed by post hoc Tukey’s test, asterisks indicate significantly different mean values (*p < 0.05; **p < 0.01, ***p < 0.001, and ****p < 0.0001).

