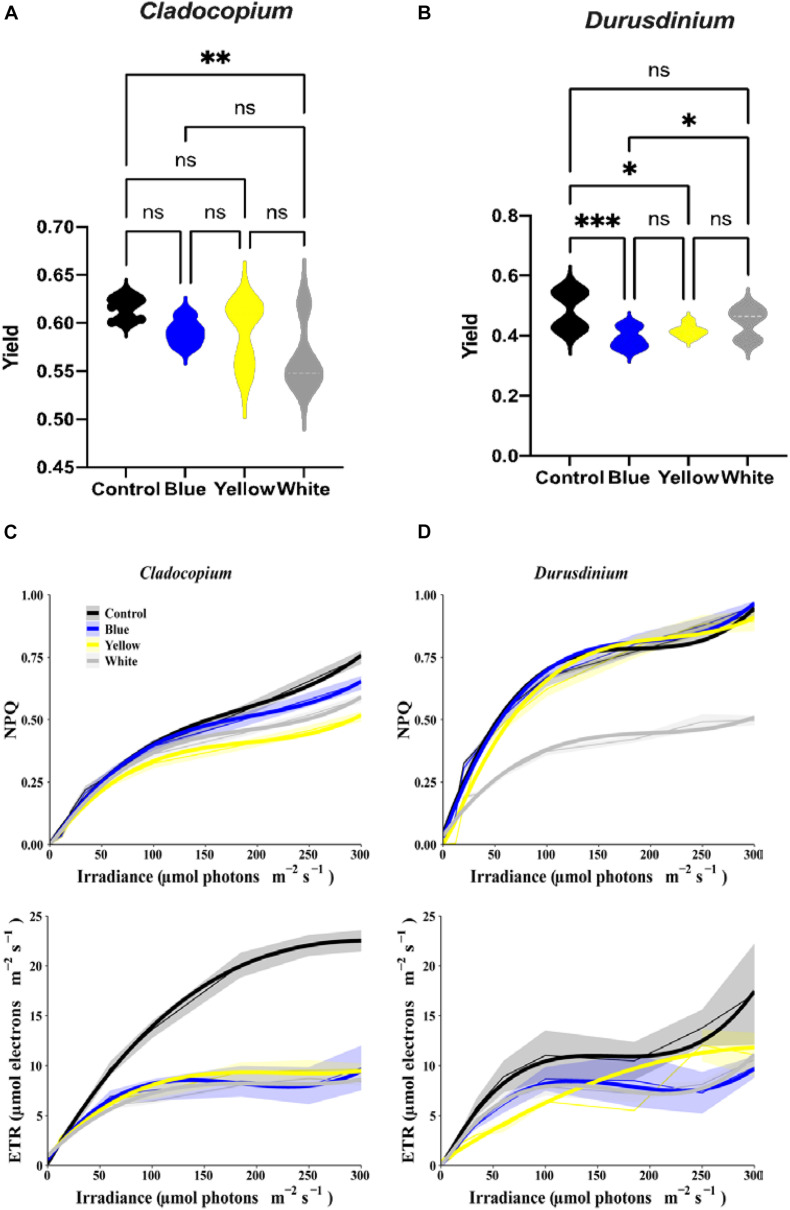
FIGURE 3.
Relationship between irradiance fluorescence measurements after one-month exposure to ALAN resulting from blue, yellow or white LEDs; irradiance level 0.15 μmol quanta m–2 s–1 (4–5 lux). Fluorescence yield (A,B), presented by violin plots with n = 12 measurements for each light treatment. ANOVA was followed by post hoc Tukey’s test, asterisks indicate significantly different mean values (*p < 0.05; **p < 0.01, and ***p < 0.001). Non-photochemical quenching NPQ (upper subplots) and ETR (lower subplots) for Cladocopium and Durusdinium (C,D). Mean ETR (±SEM) for each irradiance level (left sub-plot). Thick lines represent the predicted fit obtained from 3rd degree polynomial linear mixed models. Thin lines represent mean NPQ (or ETR) ± SEM (represented by the ribbons).

