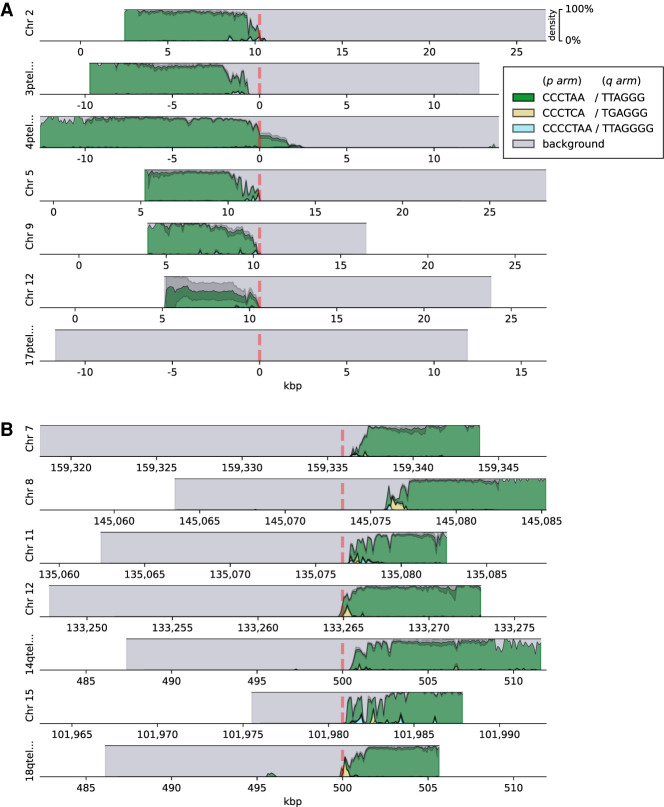
Figure 2.
Densities of the top three enriched motifs at ends of chromosomal p arms (A) and q arms (B) of the HG002 data set. Background represents the remaining sequence content (nonrepeating sequence and not significantly enriched motifs). Reads are shown aligned to the contigs in the hg38ext reference set, and genomic coordinates are given in kilobase pairs. Vertical red dashed lines denote the position of the boundary of the annotated telomeric tract.

