Table 2.
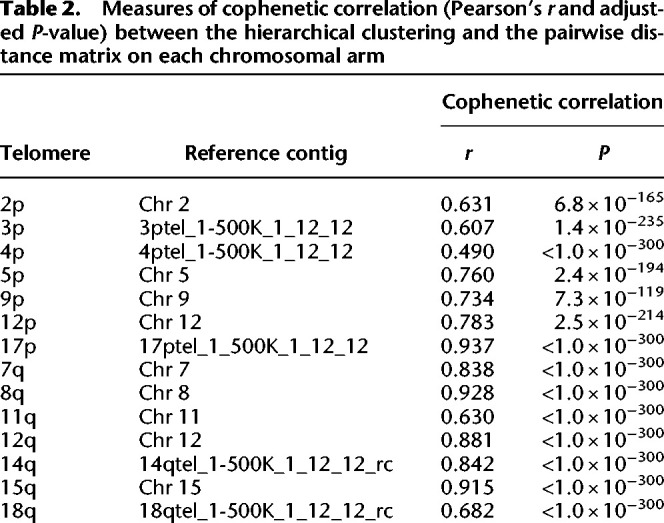
Measures of cophenetic correlation (Pearson's r and adjusted P-value) between the hierarchical clustering and the pairwise distance matrix on each chromosomal arm

Measures of cophenetic correlation (Pearson's r and adjusted P-value) between the hierarchical clustering and the pairwise distance matrix on each chromosomal arm
