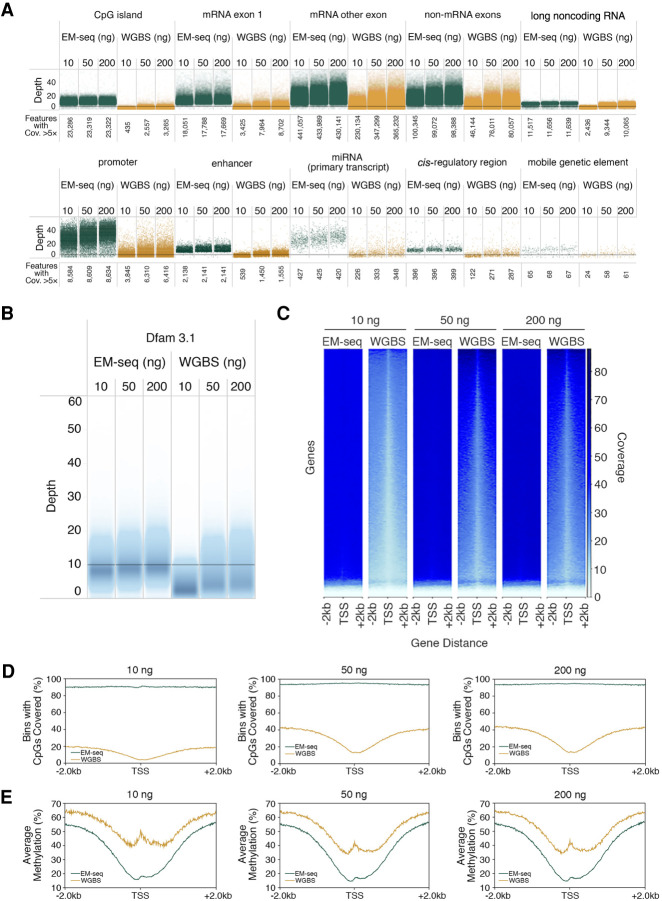
Figure 5.
Cytosine methylation at key genomic features. Genomic features for the 10-ng, 50-ng, and 200-ng NA12878 DNA EM-seq and WGBS libraries were assessed; 324 million paired reads for each library were analyzed and annotated using featureCounts (Liao et al. 2014). (A) EM-seq and WGBS cover a diverse range of genomic features, but EM-seq libraries show greater coverage of all features examined. Coverage of various genomic feature types is represented with one point per region. The vertical position is defined by the average coverage of the feature. Points are staggered horizontally to avoid too much overlapping. Features from NCBI's RefSeq, the Eukaryotic Promoter, UCSC Table Browser, and Dfam are shown, and the numbers covered at ≥5× depth are indicated. (B) Repetitive genomic regions (Dfam 3.1) are more evenly covered by EM-seq libraries. (C) deepTools2 (Ramirez et al. 2016) heat map of CpG coverage for ±2 kb of the TSS for the three DNA inputs for EM-seq and bisulfite libraries at a minimum coverage of 1×. Plots were created using random sampling of the same number of raw reads from each library. (D) Percentage of CpGs covered at a minimum of 8× coverage, ±2 kb, across TSS. (E) Methylation status for EM-seq and bisulfite libraries using 8× minimum coverage depth. EM-seq libraries show less CpG methylation and more accurately represent the expected CpG methylation pattern.

