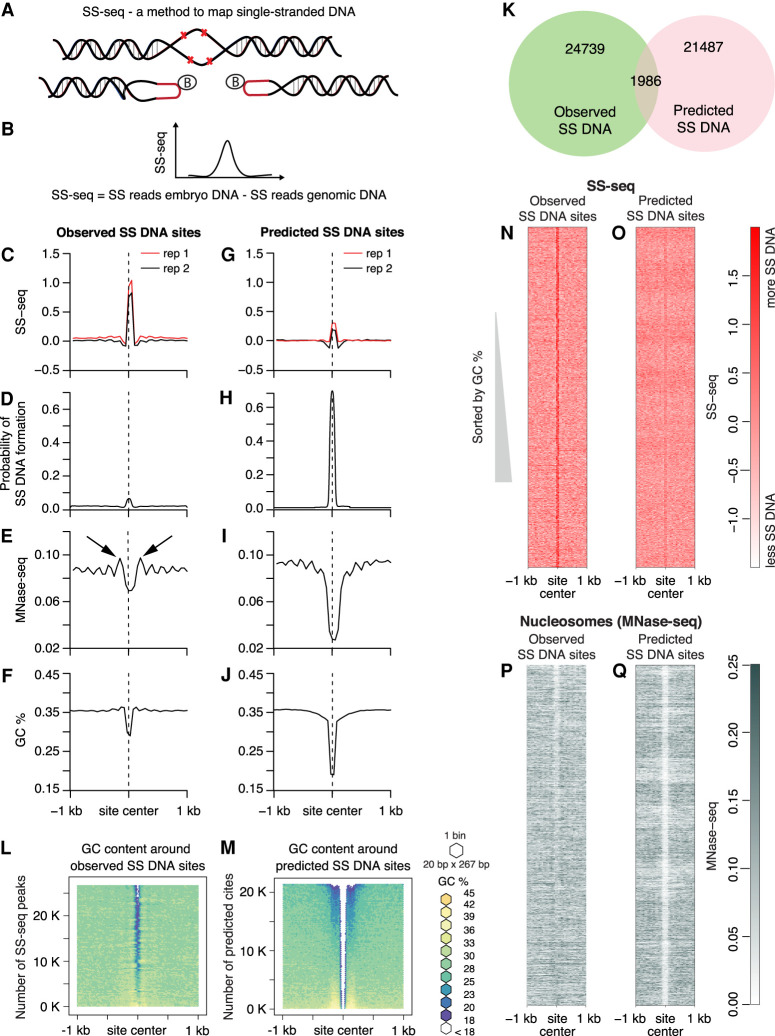
Figure 5.
Nucleosome positioning and AT-rich regions correlate with single-stranded DNA. (A,B) Strategy for genome-wide mapping of single-stranded DNA (SS-seq). (A) When KMnO4 enters purified nuclei, it modifies unpaired pyrimidine bases and prevents reannealing, creating stable single-stranded (SS) DNA. To map non-B DNA, purified KMnO4-treated DNA is digested with the single-strand-specific S1 nuclease, and exposed DNA ends are ligated to biotinylated hairpin adapters. Following DNA sonication to generate 300-bp fragments, biotinylated DNA ends are enriched on streptavidin beads, and a second set of adapters is ligated. After digestion of adapter hairpins, the library is amplified and sequenced. The same procedure is applied to naked genomic DNA as a control. Details of the method are in Supplemental Figure S8A. (B) The distribution of the difference in counts from KMnO4-treated nuclear DNA and genomic control DNA is calculated genome-wide. The SS-seq signal represents the residual signal obtained by subtracting SS reads from naked genomic DNA from the SS reads from embryo DNA. Sites of KMnO4 reactivity are identified by peaks in the SS-seq signal. (C–J) Multiparamteric comparison of observed SS-seq peaks and predicted single-stranded regions. Average profiles of SS-seq in the 2-kb region around observed (C) and predicted (G) SS DNA sites were plotted at 50-bp resolution. Average profiles of SIST-predicted probability of strand separation in the 2-kb region surrounding observed (D) and predicted (H) SS DNA sites. Nucleosome profile (MNase-seq) in the 2-kb region around observed (E) and predicted (I) SS DNA sites. Black arrows indicated well-positioned nucleosomes. Average GC content in the 2-kb region around observed (F) and predicted (J) SS DNA sites is plotted at 50-bp resolution. (K) Venn diagram shows intersection between predicted and observed SS DNA sites. (L,M) Heatmaps of GC content in the 2-kb region around observed SS-seq peaks and predicted SS DNA sites. SS-seq peaks and predicted sites were sorted by GC content; the surrounding sequences were aligned on top of each other and then binned (20 bp × 267 bp for L and 20 bp × 215 bp for M). Each bin was colored according to its GC percentage. (N,O) Heatmaps of SS-seq signal in the 2-kb region surrounding observed SS-seq peaks and predicted SS DNA sites that were sorted as in L and M. (P,Q) Heatmaps of MNase-seq in the 2-kb region around observed SS-seq peaks and predicted SS DNA sites, which were sorted as in L and M.

