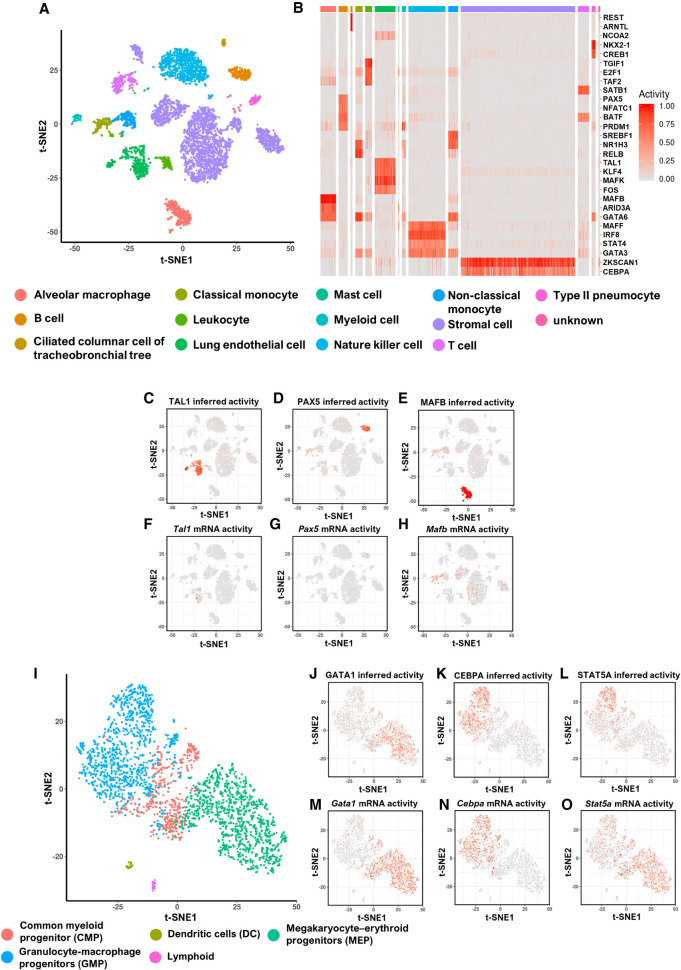
Figure 2.
Transcription factor activities inferred by BITFAM correspond to known biological functions. (A) t-SNE plot of the Tabula Muris lung data set in which cells are colored by biologically defined cell types. The input to t-SNE algorithm is the log-normalized scRNA-seq profile. (B) Heatmap of inferred activities of specific transcription factors for each cell type in the lung. The columns are the cells and are grouped by cell type. The rows are the inferred transcription factor activities. (C–E) Inferred activities of TAL1, PAX5, and MAFB in the Tabula Muris lung data, respectively. (F–H) Log-normalized mRNA expression of Tal1, Pax5, and Mafb in the Tabula Muris lung data. (I) t-SNE plot of blood cell development data colored with cell types. (J–L) Inferred activities of GATA1, CEBPA, and STAT5A in the blood cell development data set. (M–O) Log-normalized mRNA expression levels of Gata1, Cebpa, and Stat5a in the blood cell development data set.

