Figure 4.
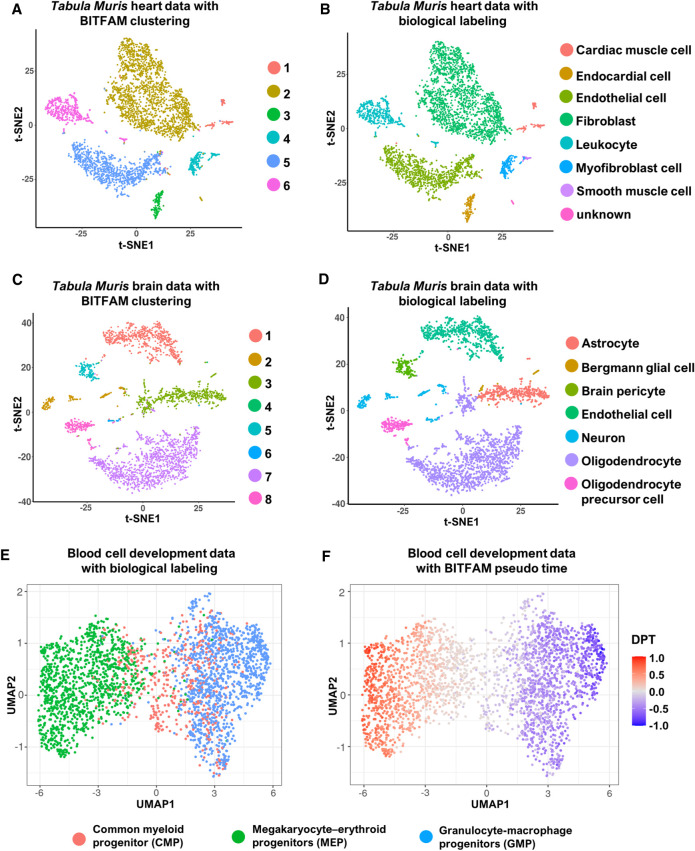
Clustering of cell subpopulations by inferred transcription factor activities. (A) t-SNE plot of the Tabula Muris heart data set in which cells are colored by BITFAM clusters. (B) t-SNE plot of the Tabula Muris heart data set in which cells are colored by biologically defined cell types. (C) t-SNE plot of the Tabula Muris brain data set in which cells are colored by BITFAM clusters. (D) t-SNE plot of the Tabula Muris brain data set in which cells are colored by biologically defined cell types. (E) UMAP plot of the inferred transcription factor activities in the blood cell development data set with cells colored by biologically defined cell types. (F) UMAP plot of the inferred transcription factor activities colored by the pseudo-time values calculated by the standard DPT workflow.

