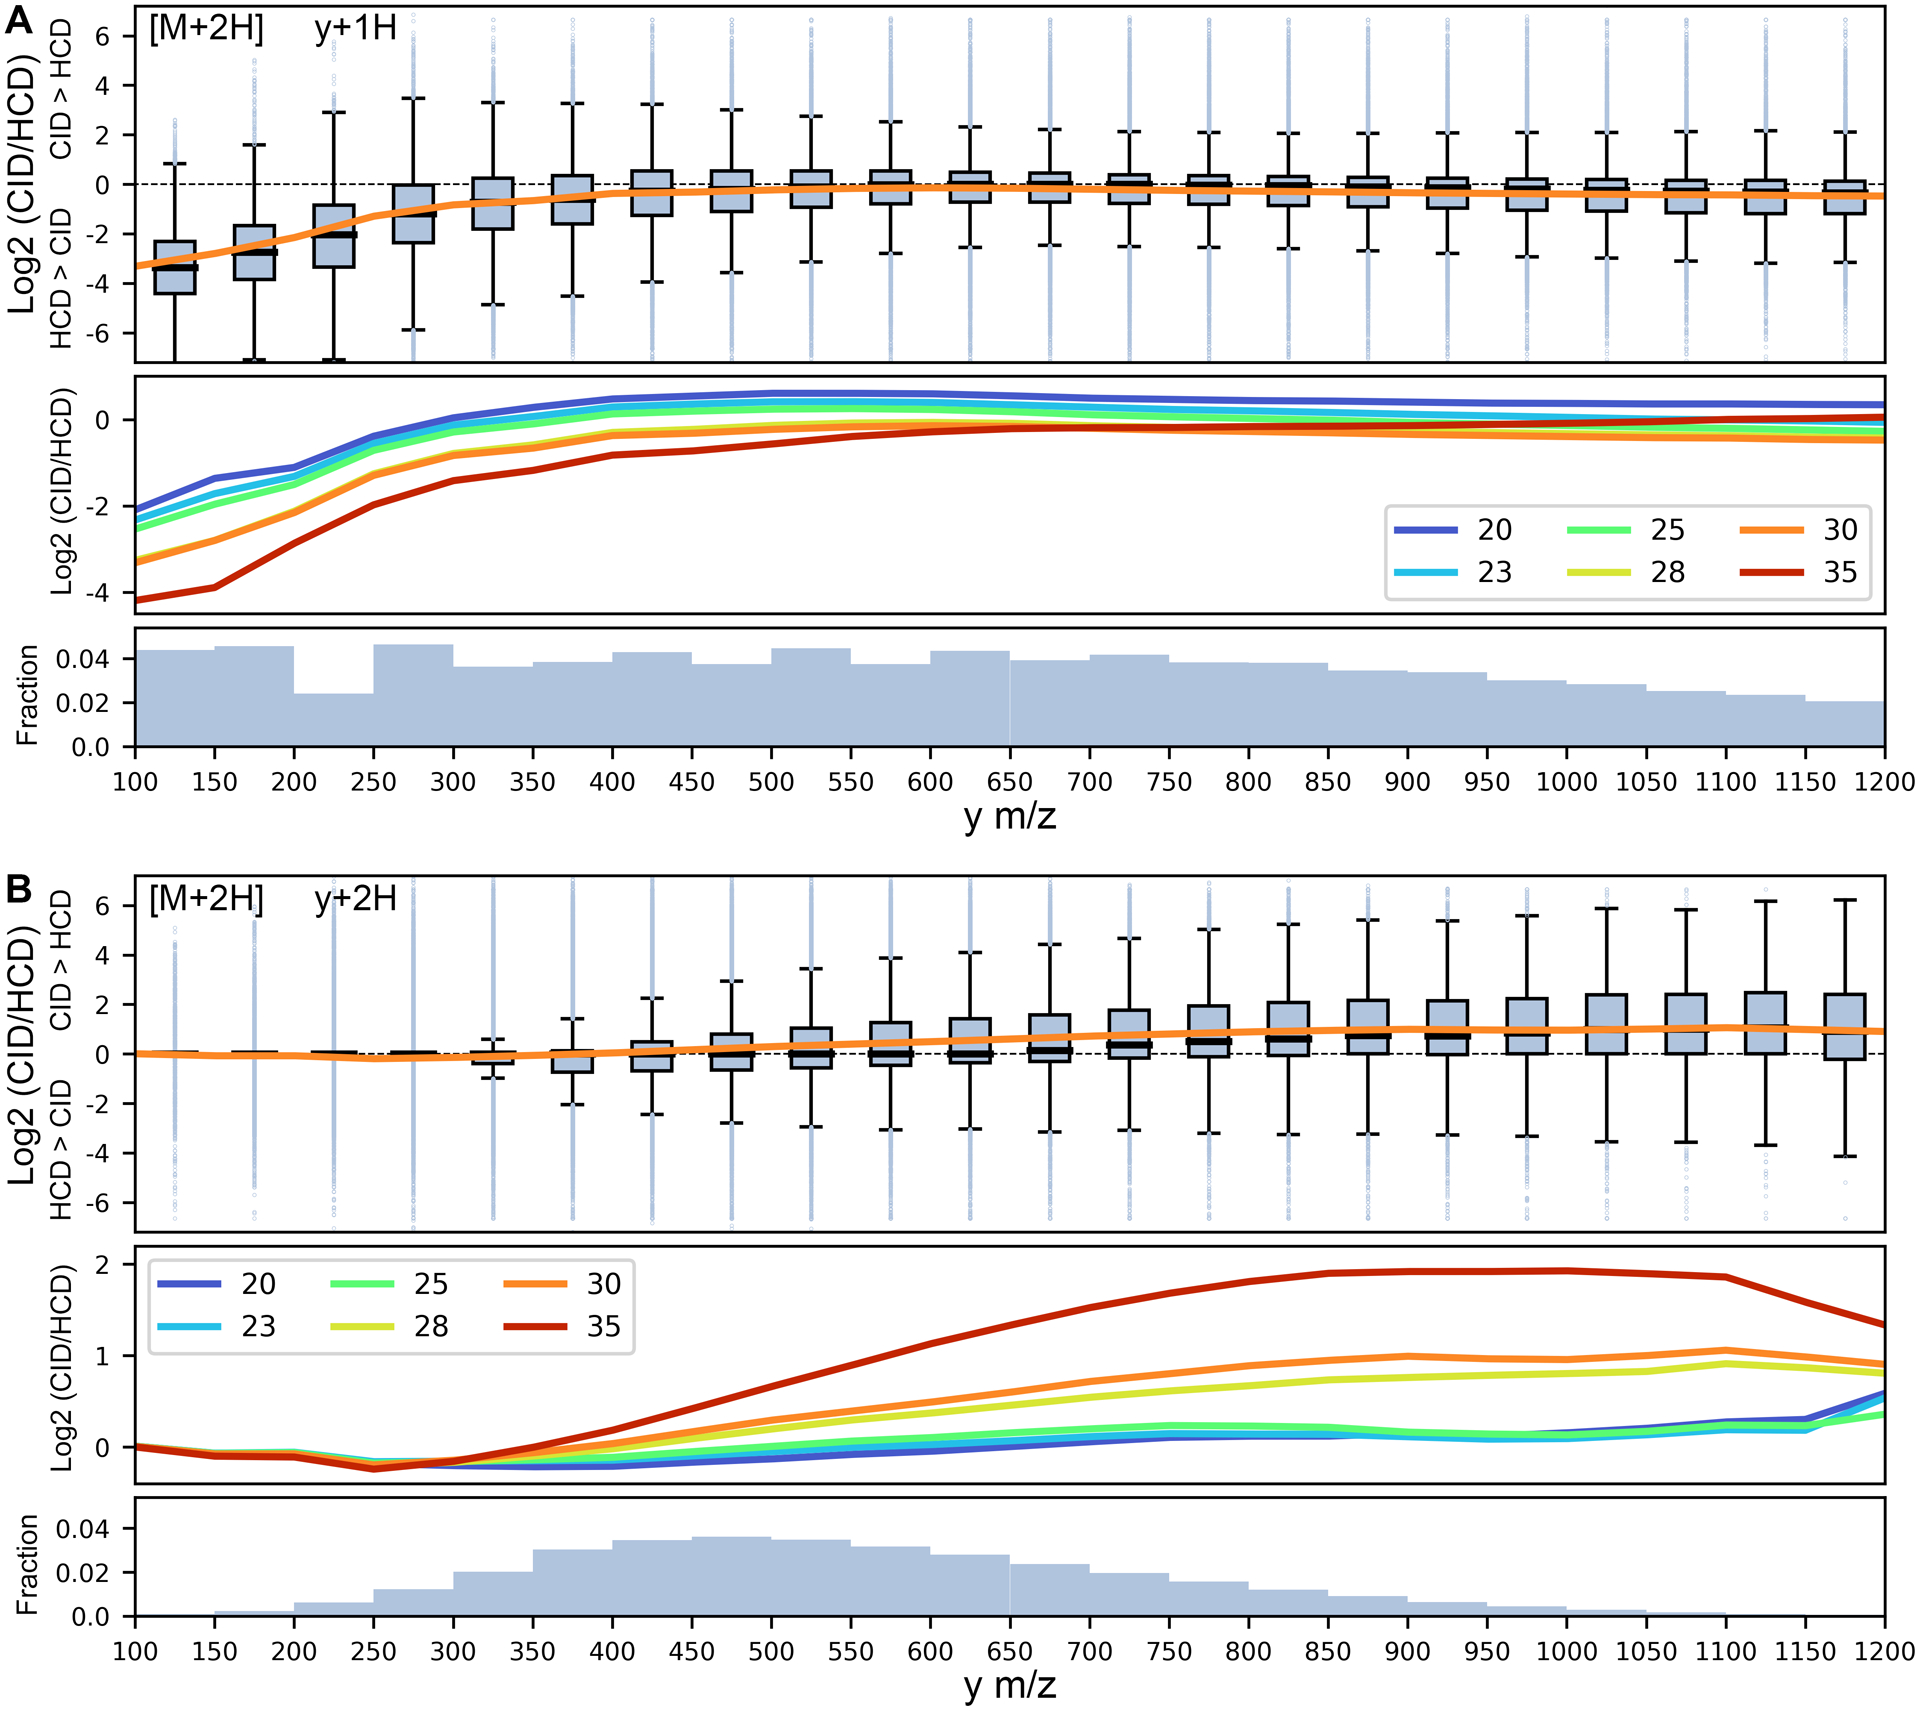
Figure 1. Effect of y-ion m/z on CID/HCD ratio of y-ions in M+2H peptides.

Box plot representation of the log2 transformed ratio for y-ion intensities in CID compared to HCD at NCE 30 as a function of y m/z (in 50 m/z bins), with positive and negative values implying higher CID and HCD intensities, respectively, for (A) y+1H ions and (B) y+2H ions. Boxes reflect the range between the 25 and 75 percentiles, with dark lines denoting the mean and outliers beyond the mean ± 1.5 times the interquartile range. The secondary panels show regression lines at different NCE values, and the tertiary panels denote the fraction of fragments in each m/z bin.
