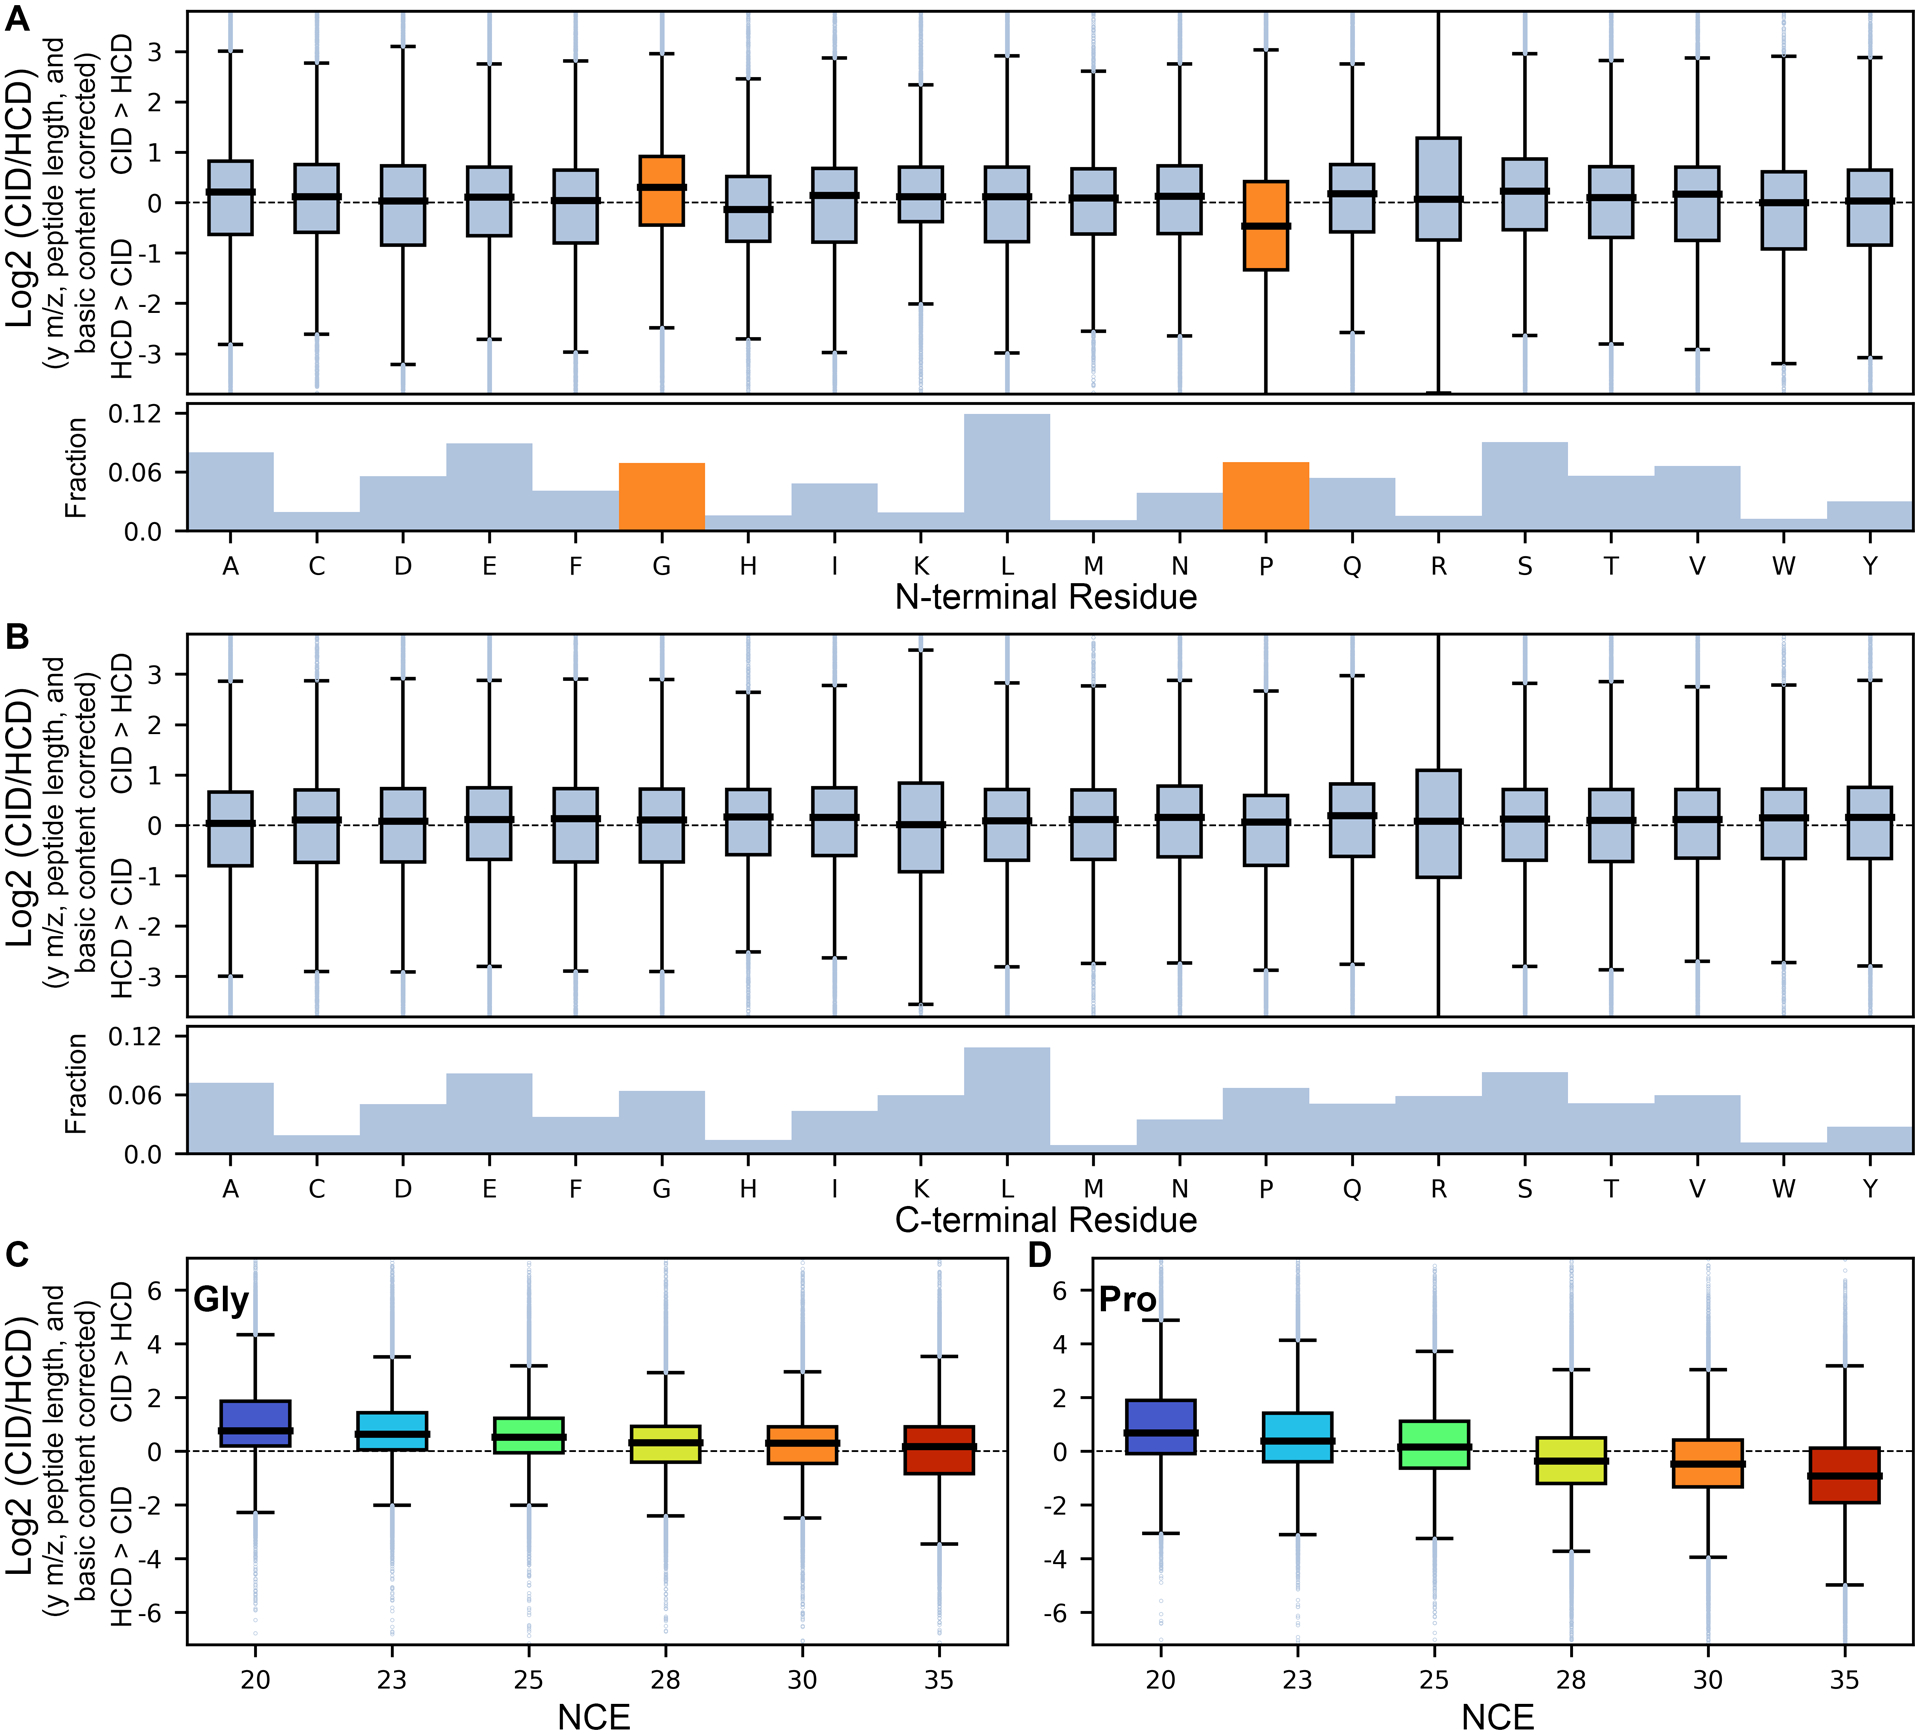
Figure 3. N- and C-terminal bond cleavage residue effects on CID/HCD ratio for y+1H ions of M+2H peptides.

Box plot representation of bond cleavage residues on CID vs HCD intensity after normalizing for mass (y-ion m/z and peptide length) and basic residue contributions for (A) the N-terminal side of the bond cleavage and (B) the C-terminal side at NCE 30, as well as the variable effect of NCE on N-terminal (C) Gly and (D) Pro residues. Boxes reflect the range between the 25 and 75 percentiles, with dark lines denoting the mean and outliers beyond the mean ± 1.5 times the interquartile range, with orange boxes reflecting effects that explain >0.1% of the variance and included in the model.
