
Figure 4. Comparison of CIDer performance to HCD libraries and machine learning tools (Evaluation Dataset 1).
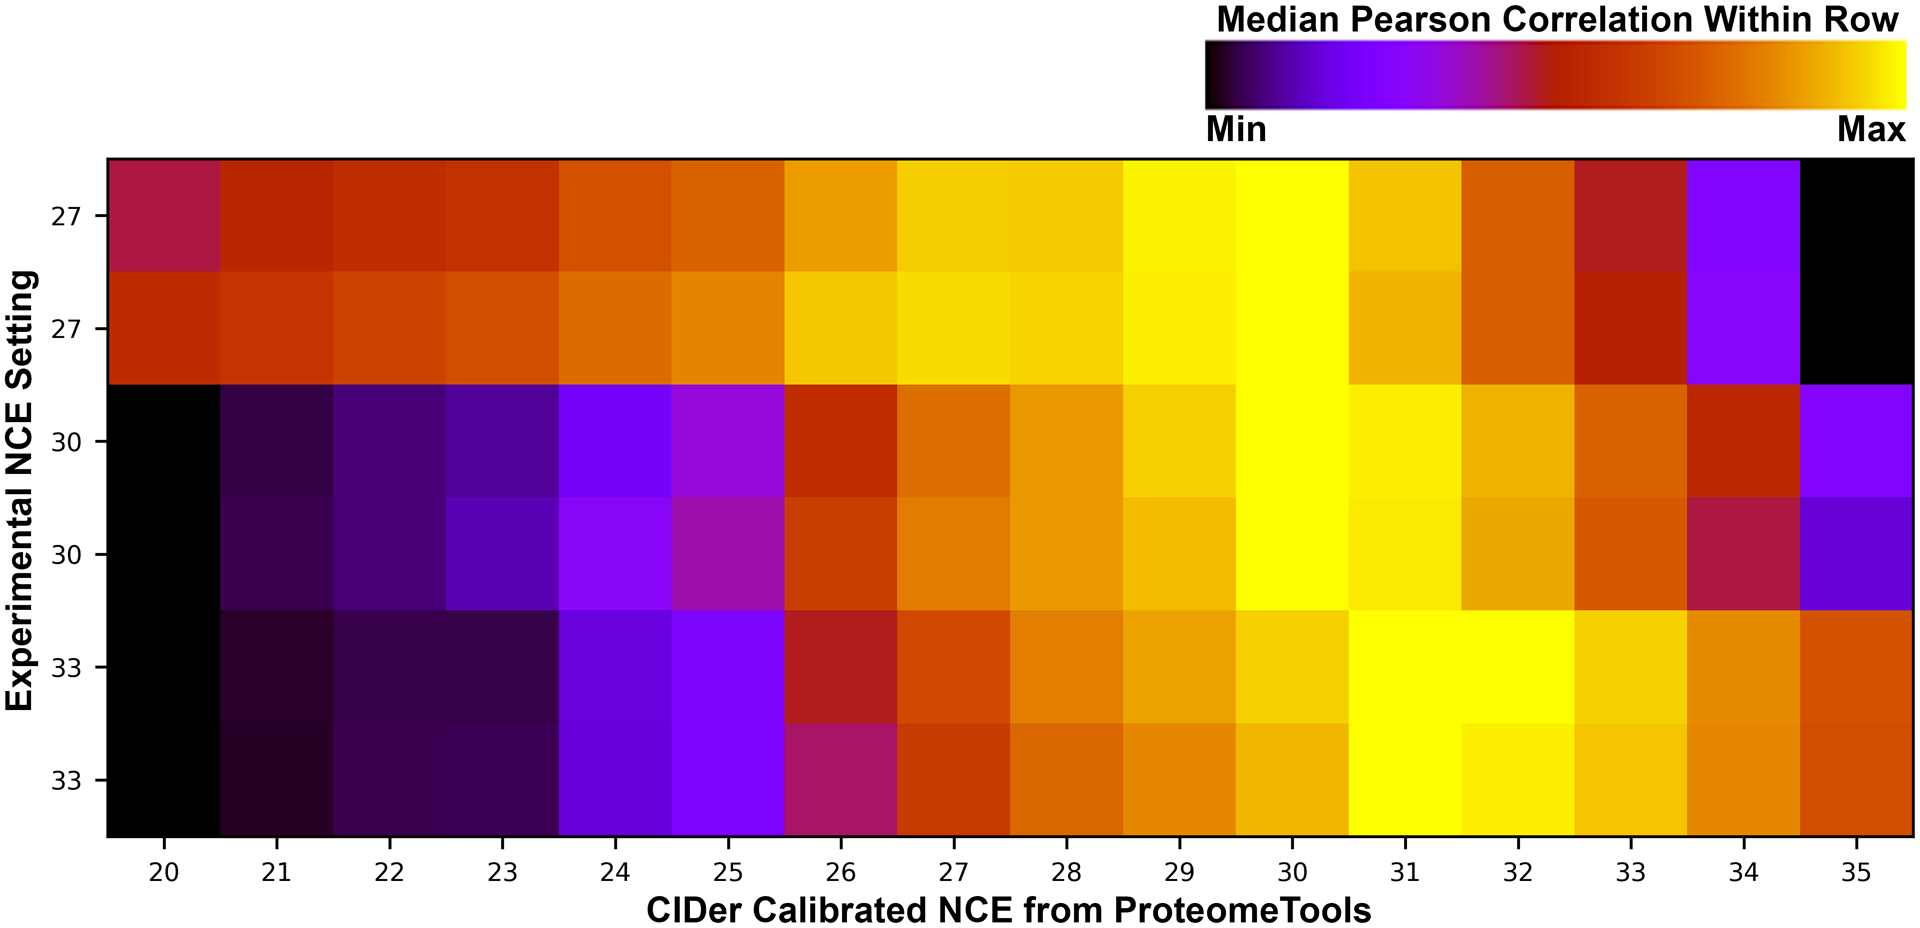
HCD libraries were collected in duplicate at three different experimental NCE settings (27, 30, and 33), and processed by CIDer at sixteen different NCE settings (20–35, calibrated based on ProteomeTools libraries). Median Pearson correlation coefficients are plotted for these CIDer converted HCD libraries and CID data acquired on the same instrument. Each row is normalized from black (lowest correlation) to yellow (highest correlation) for visualization.