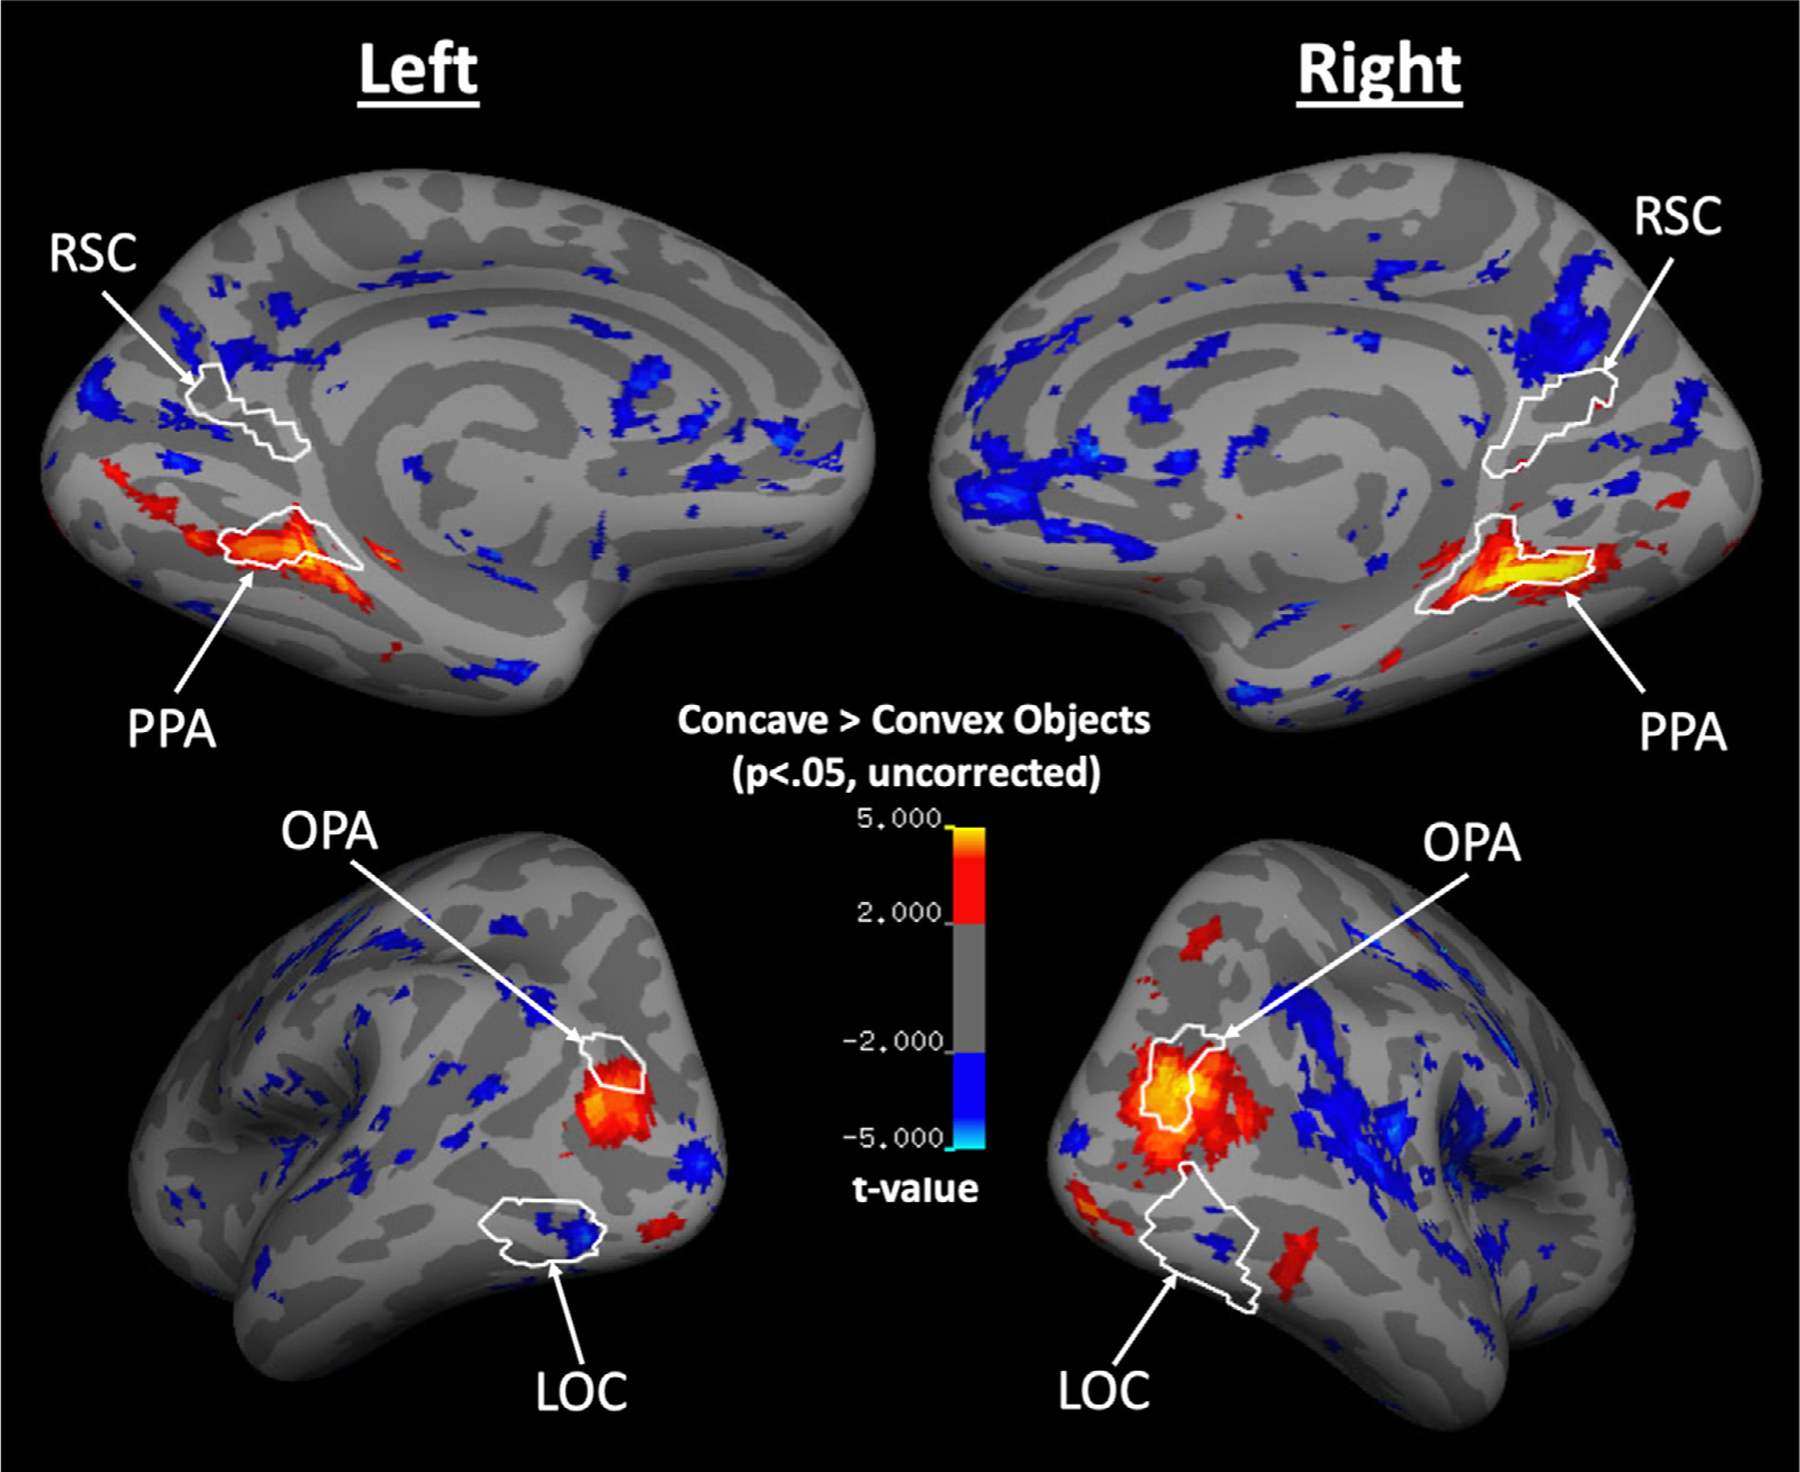
Fig. 2.

A group cortical surface map for regions that responded more to Concave Objects than Convex Objects. White lines indicate the ROIs that were functionally defined at the group level, using an independent set of Localizer runs. PPA and OPA overlap with cortical regions that respond more to Concave over Convex Objects, with a relatively stronger Concave selectivity at the more posterior parts of these cortical regions.
