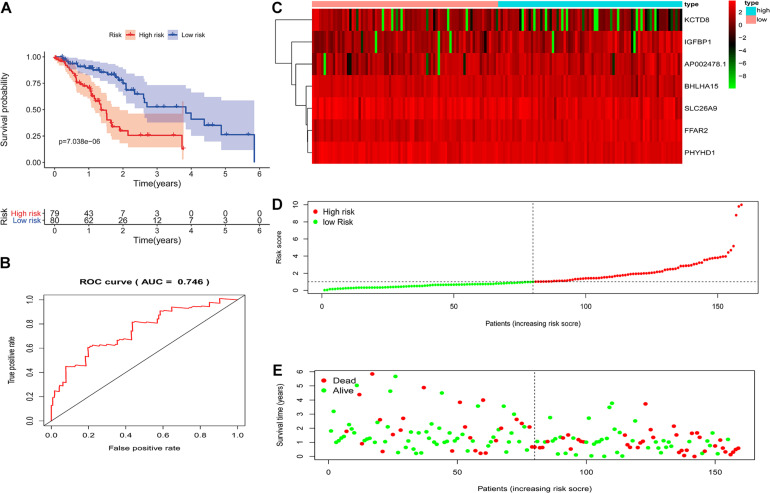
FIGURE 5.
The prognostic values of the signature. (A) Kaplan-Meier survival curves of the relative overall survival of high- and low-risk patients. (B) ROC curve analysis of the prognostic signature. (C) Heatmap of three-gene expression profiles in the high- and low-risk groups. (D) The distribution of the three gene-based risk scores. (E) Vital statuses of patients in the high- and low-risk groups.

