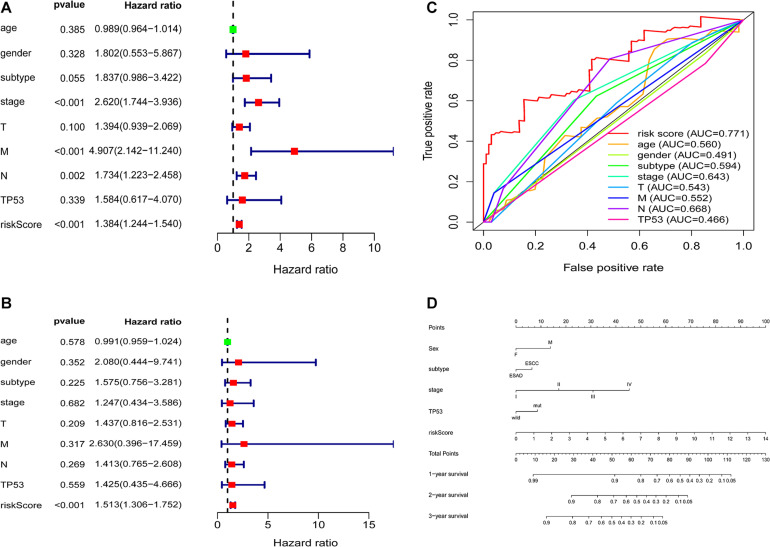
FIGURE 7.
Correlation between the seven-gene signature and patient clinical characteristics (A,B) Univariate and multivariate Cox regression analyses of the correlations between the TP53-associated signature and clinical characteristics with overall survival. (C) ROC curve analyses of age, sex, subtype, stage, T stage, M stage, N stage, TP53, and prognostic risk model. (D) Nomogram for predicting the 1-, 3-, and 5-year overall survival of patients with ESCA.

