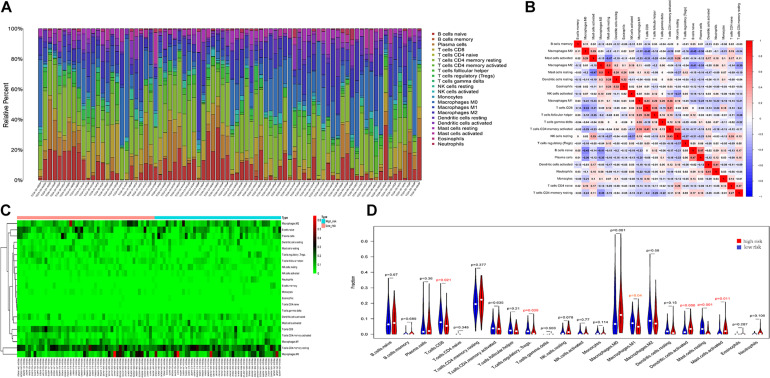
FIGURE 9.
Immune cell infiltration landscapes in high- and low-risk patients with ESCA. (A) Relative level of immune cell infiltration in high- and low-risk patients. (B) Correlation matrix and (C) heatmap of the 22 immune cell proportions. (D) Differences in immune cell infiltration between high- and low-risk patients.

