Fig. 8.

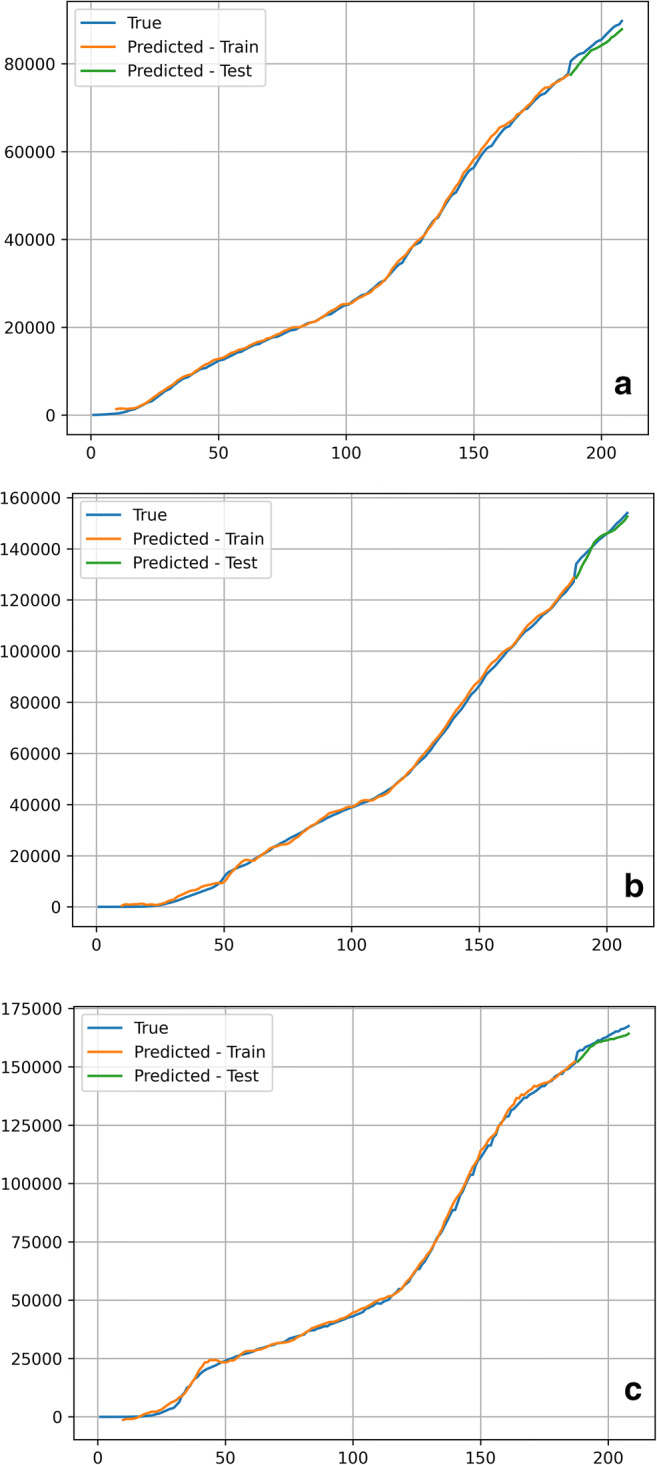
The comparison of the predicted and true values employing GRU-based DA-RNN on three different states. (a) Washington (b) Ohio (c) Los Angeles

The comparison of the predicted and true values employing GRU-based DA-RNN on three different states. (a) Washington (b) Ohio (c) Los Angeles