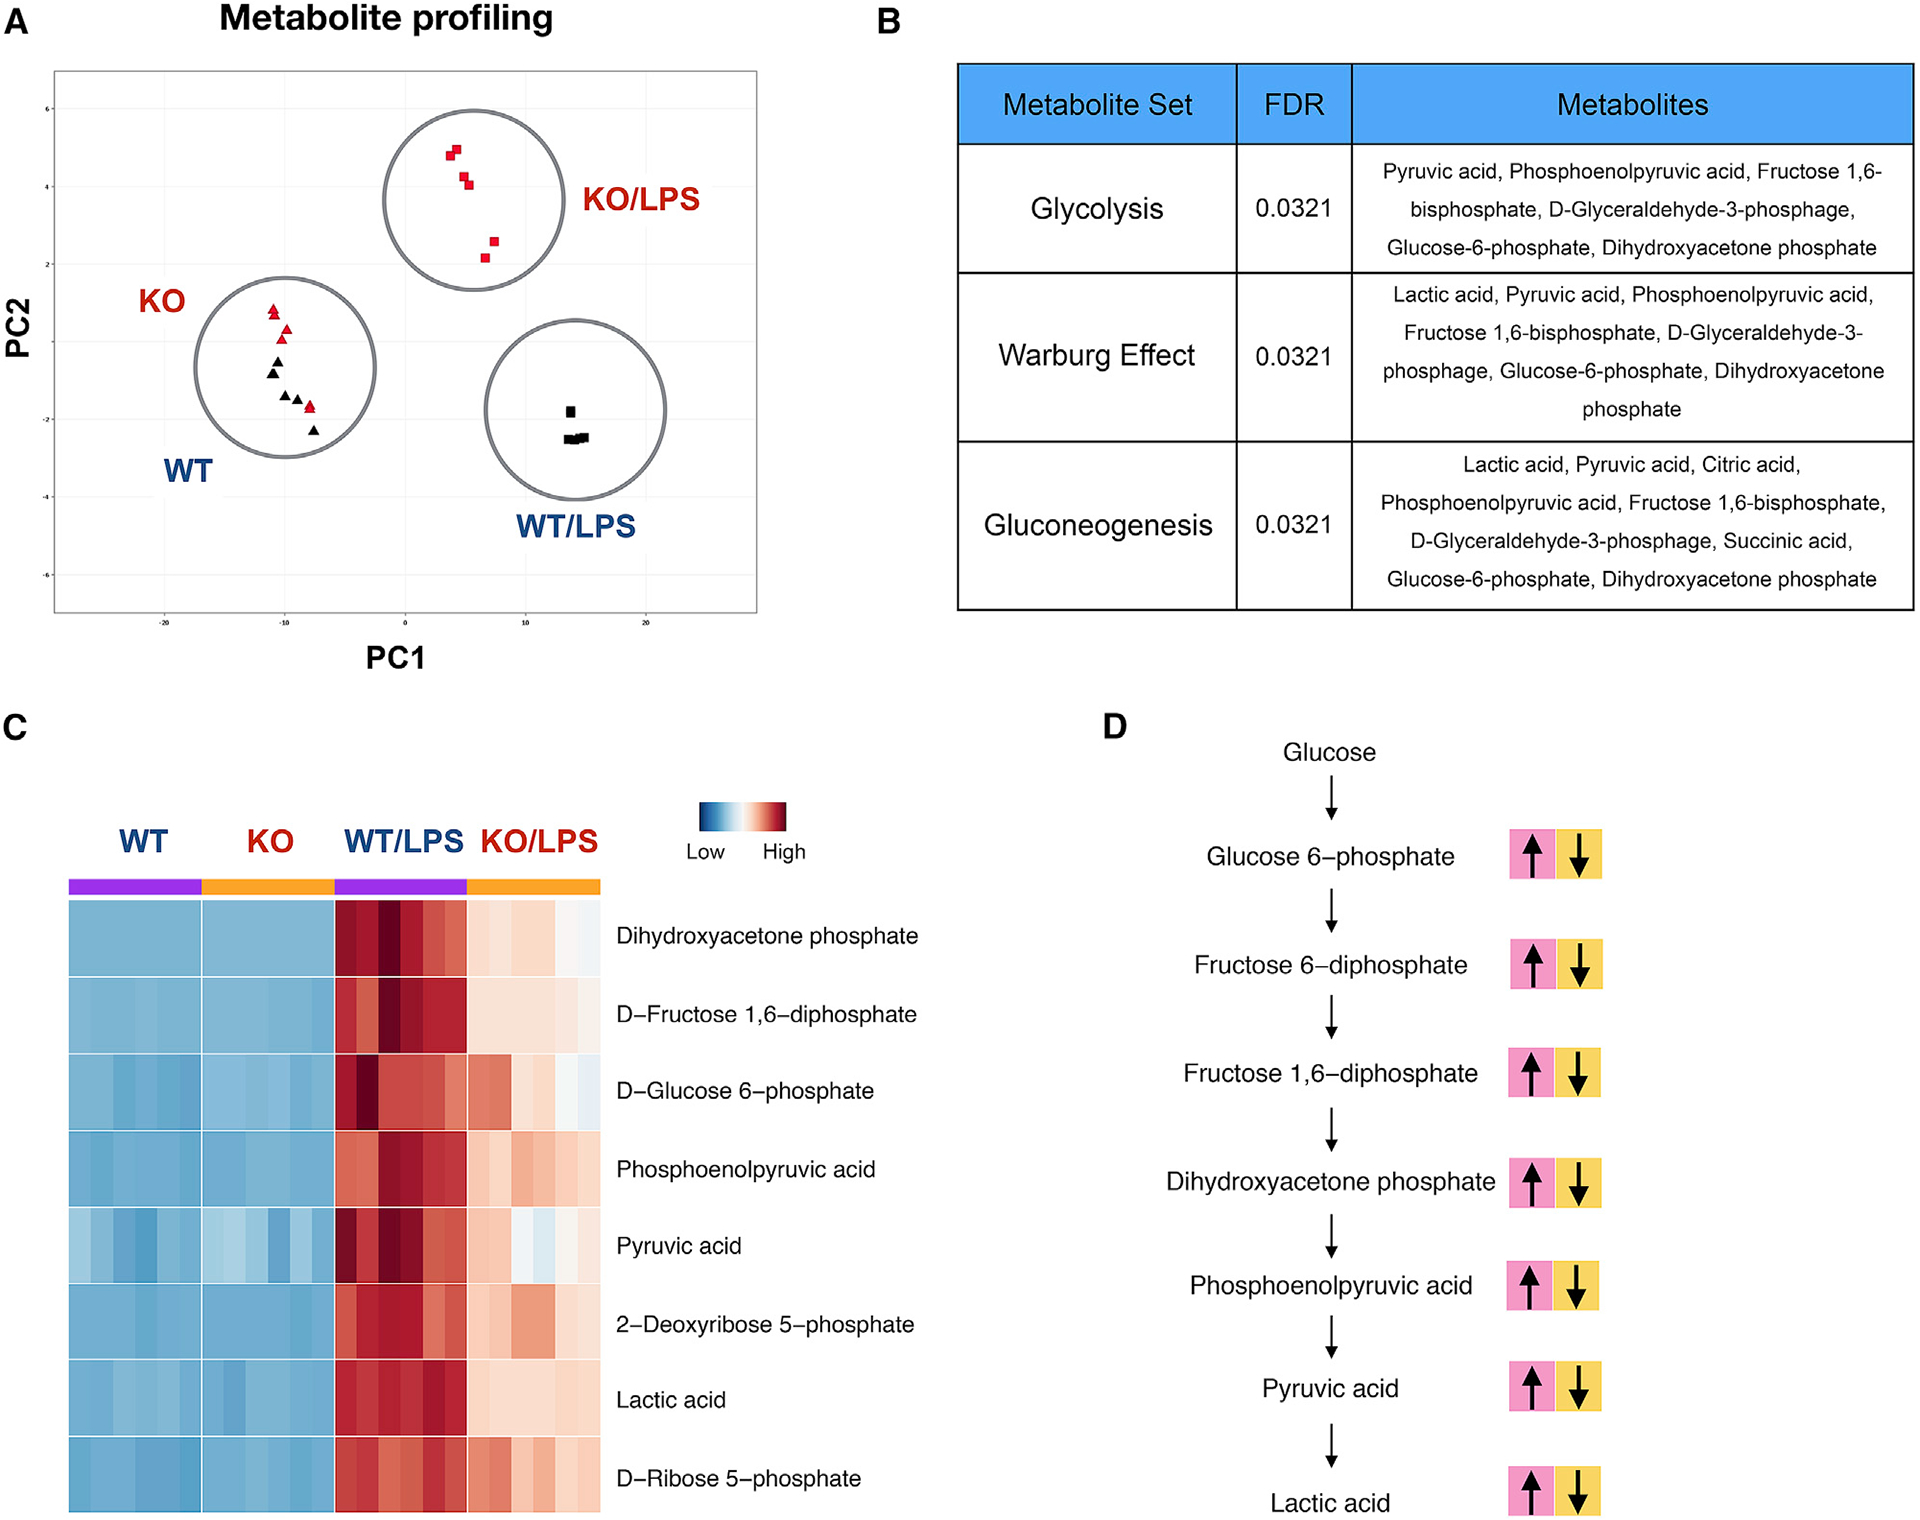
Figure 1. MYC regulates glycolytic metabolism upon LPS stimulation.

Metabolite analysis in control (WT) and MYC-deficient (KO) BMDMs after LPS (100 ng/ml) stimulation for 24 h.
(A) Principal-component analysis of the metabolites.
(B) Pathway-enrichment assay of the metabolites by metaboanalyst.
(C) Heat map showing the levels of the glycolytic metabolites.
(D) A schematic map showing metabolic changes in glycolytic pathways during macrophage polarization. Pink blocks represent metabolites upregulated by LPS in WT BMDMs. Yellow blocks represent metabolites whose abundance is diminished by MYC deficiency. Detailed values are shown in Table S1.
