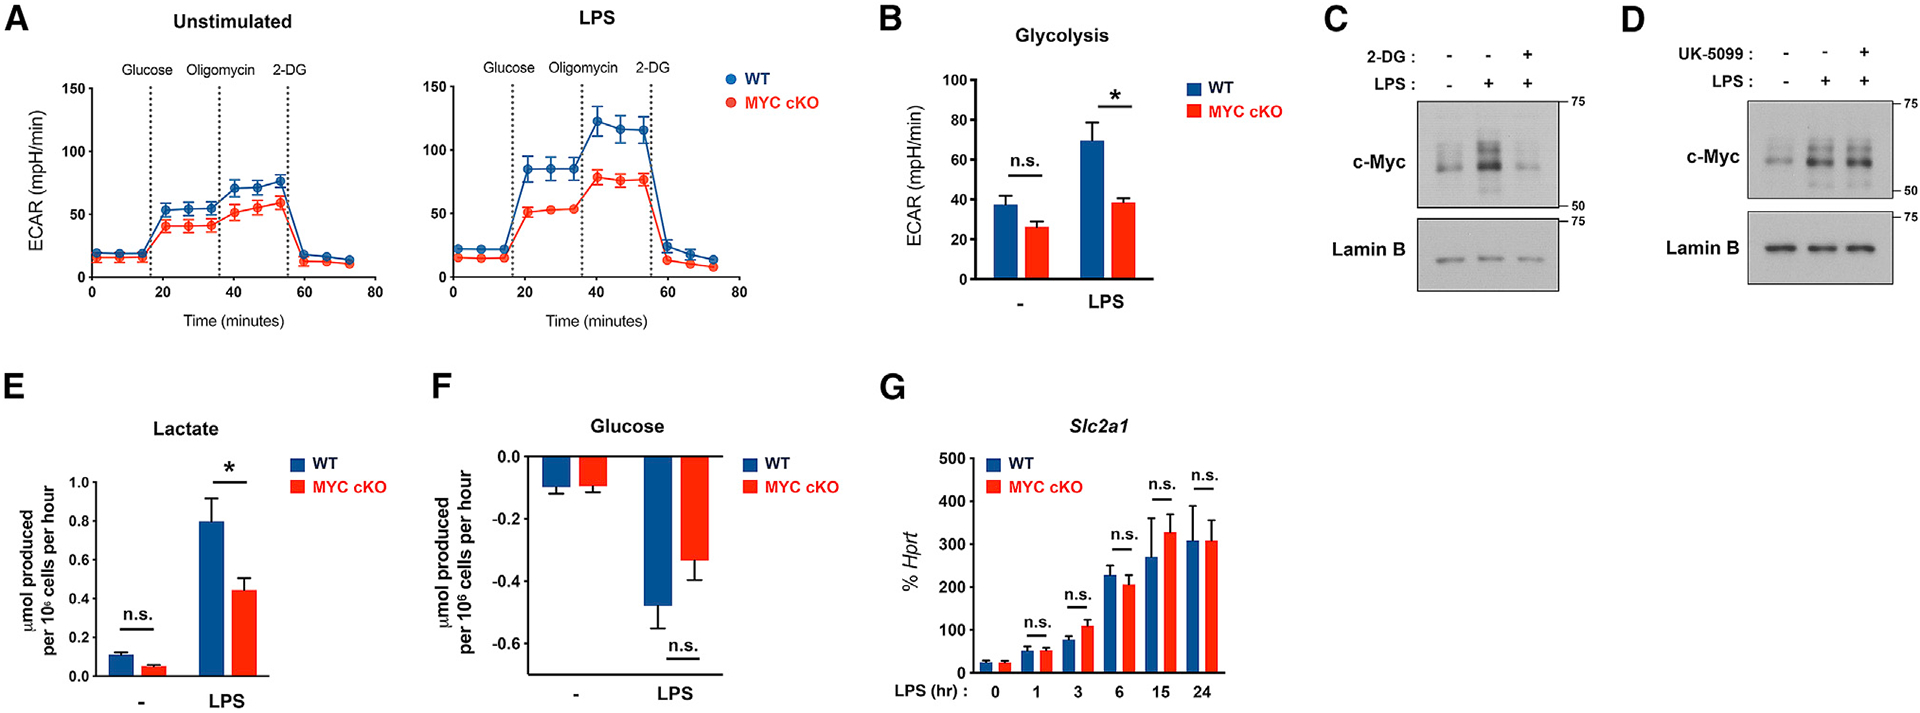
Figure 2. MYC-deficient BMDMs exhibit a defect in early glycolytic responses upon LPS stimulation.

(A) Graph showing seahorse glycolysis stress tests in WT and MYC-deficient (MYC cKO) BMDMs after LPS (50 ng/ml) stimulation for 3 h (n = 8).
(B) Bar graphs showing the quantified glycolysis from stress tests in (A) (n = 8).
(C and D) Effect of 2-DG and UK-5099 on LPS-induced MYC expression. BMDMs were treated with 2-DG (5 mM, 30 min) or UK-5099 (100 μM, 3 h) and then stimulated with LPS (100 ng/ml) for 1 h. The expression of MYC was determined by immunoblot using nuclear lysates. Lamin B served as a loading control. Data are representative of at least 3 experiments.
(E and F) Extracellular level of lactate (E) or glucose (F) in the culture supernatants after LPS (100 ng/ml) stimulation for 20 h was determined by YSI analyzer (n = 4).
(G) The mRNA expression of Slc2a1 after LPS (100 ng/ml) stimulation for the indicated time points (n ≥ 3).
All data are shown as mean ± SEM. *p < 0.05; n.s., not significant by two-way ANOVA with a post hoc Tukey test.
