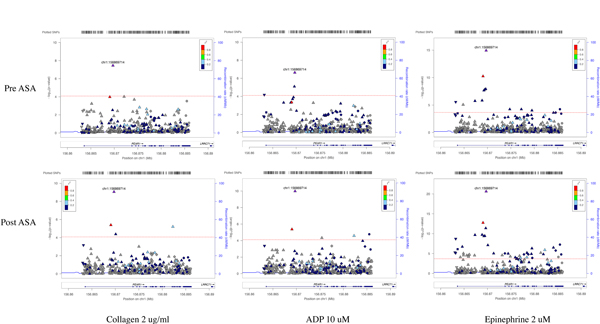
Figure 2:
Meta-analysis of association tests between PEAR1 variants with 3 platelet aggregation phenotypes in GeneSTAR families. Platelet aggregation was measured in response to collagen 2 ug/ml, ADP 10 uM and epinephrine 2 uM at baseline (pre-ASA) and 14 days after aspirin therapy (post-ASA). rs12041331 (purple triangle chr1:156869714) was significantly associated with all platelet aggregation related phenotypes at baseline and after aspirin therapy. Red lines reflect the Bonferroni threshold.

